Table Analysis, commonly abbreviated as TA, is one of the most distinctive types on the GMAT. Its format feels different from what many students encounter in regular academic work, which is why it can feel unfamiliar in the beginning. GMAT Table Analysis questions place you in front of a dynamic data table and invite you to explore it with purpose. You read values, compare figures, notice patterns, and connect relationships, all while checking whether the given statements truly align with what the data shows. At its core, the GMAT uses this format to assess how steadily and logically you interpret information in a structured table. Within the 20 questions that make up the Data Insights section of the GMAT, Table Analysis questions form an important share of ~3 questions, making thorough coverage of TA an essential part of a reliable GMAT prep course.
On this page, we present a range of sample table analysis questions designed to give you direct exposure to how different concepts are tested through the table analysis question type on the GMAT. As you work through these questions, without worrying about speed, use this opportunity to gain first hand familiarity with the table analysis question format, flow, user interface, and the layers of logic that shape each question. Keep your focus on carefully engaging with the questions and the reasoning required to arrive at correct answers. Use this resource thoughtfully to build broad exposure to the GMAT table analysis question type in a short span, and carry these learnings forward into subsequent GMAT quizzes, GMAT sectional tests, and GMAT full-length practice tests. Happy practicing!
Important: Before visiting the Table Analysis sample questions, if you would like a quick brush up of key TA concepts, you may first visit: Free GMAT Table Analysis Prep
Table Analysis Sample Question 1
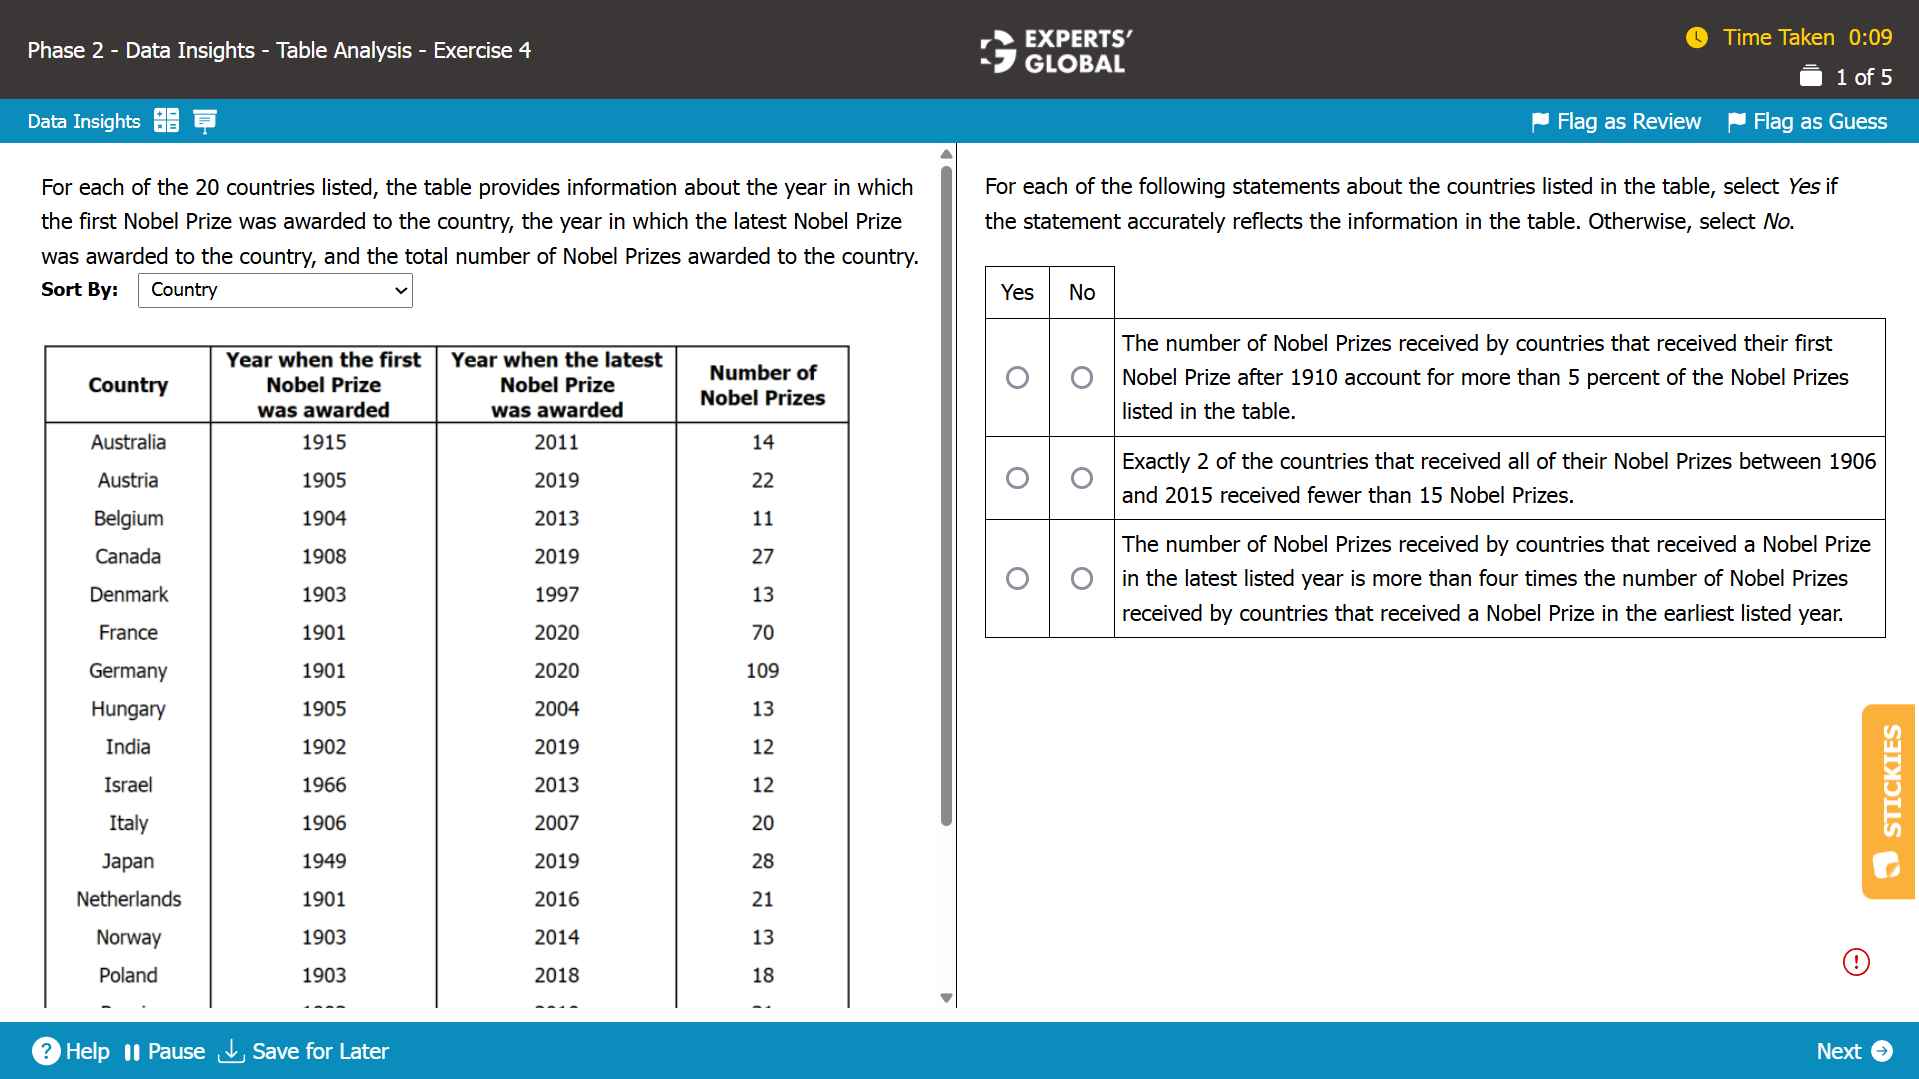
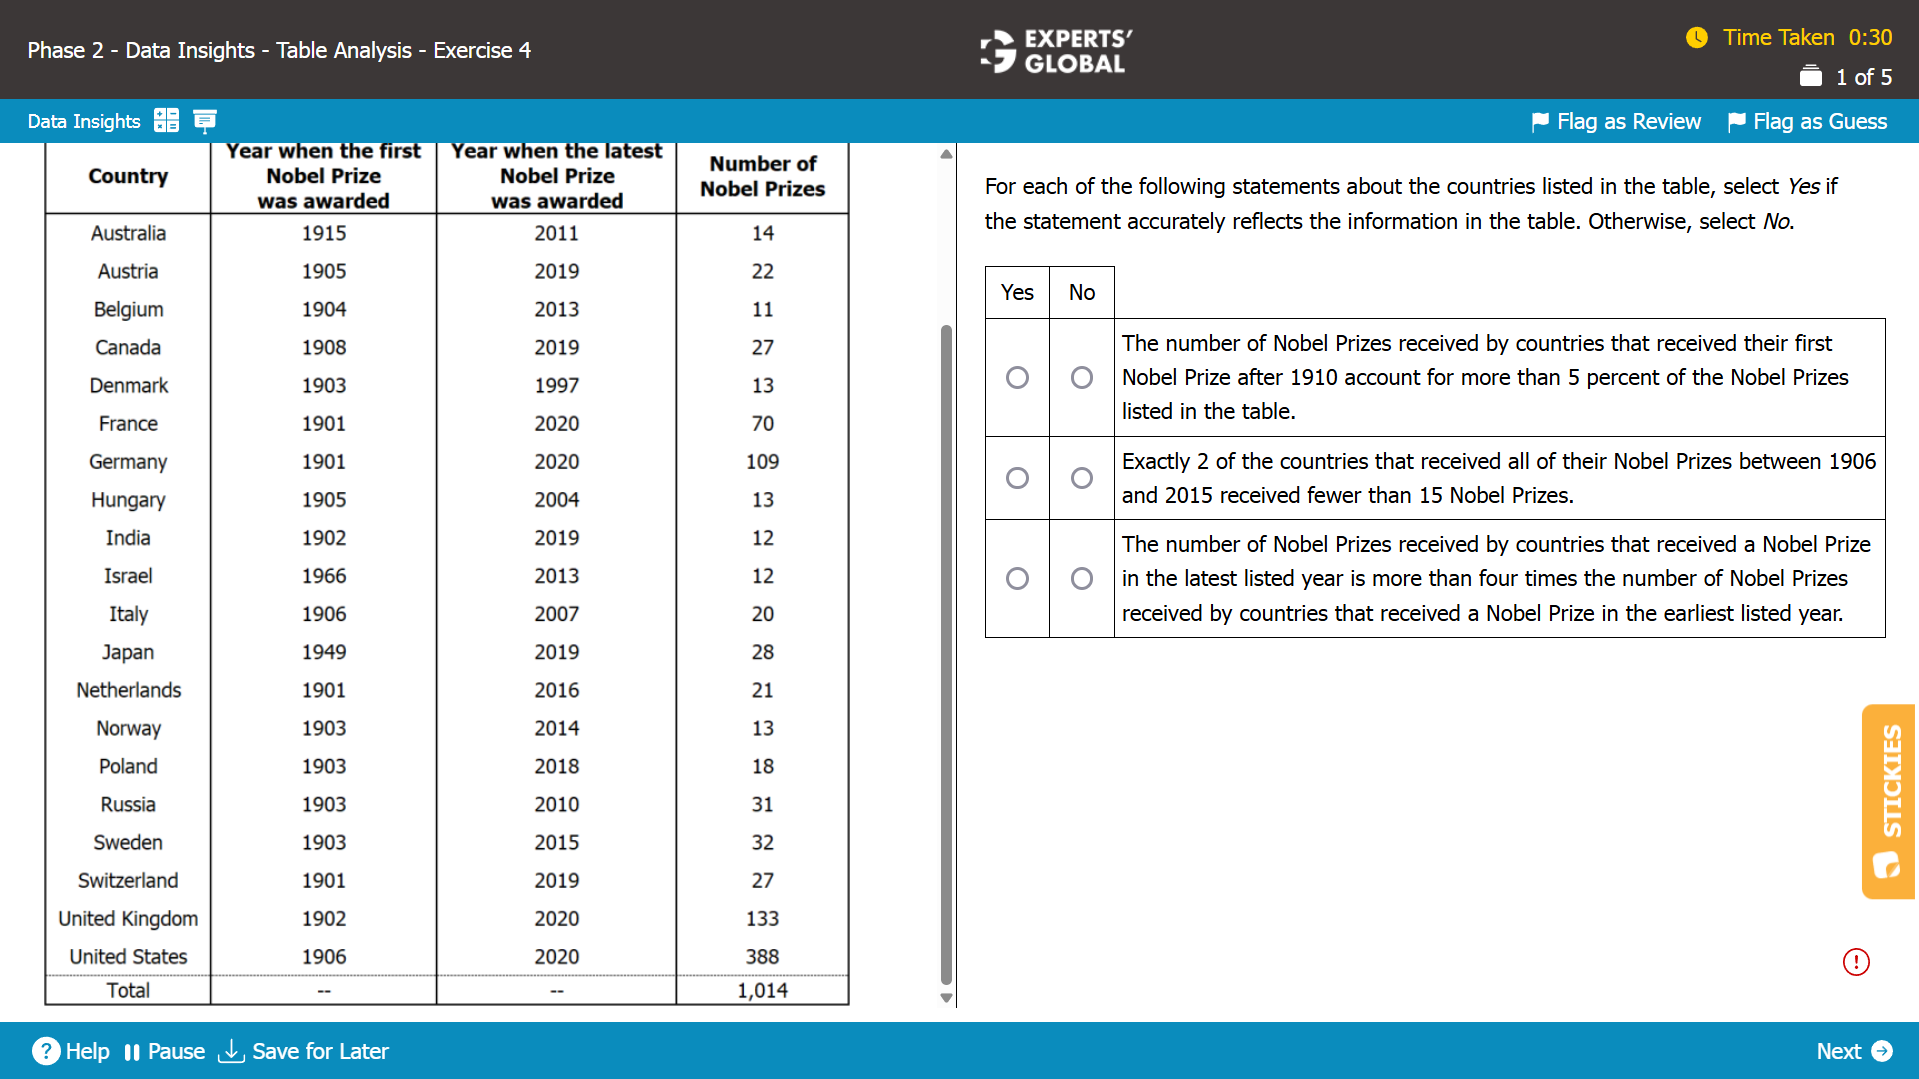
I.
There are 3 countries in the table that received their first Nobel Prize after 1910 (Australia, Israel, and Japan).
The number of Nobel Prizes received by Australia, Israel, and Japan is 14, 12, and 28 respectively.
Total number of Nobel Prizes received by countries that received their first Nobel Prize after 1910 = 14 + 12 + 28 = 54
Total number of Nobel Prizes received by all 20 countries = 1,014
Percentage of Nobel Prizes received by countries that received their first Nobel Prize after 1910 = 54 / 1,014 = 5.3% > 5%
Hence, this statement accurately reflects the information in the table.
II.
Australia, Israel, and Italy are the only 3 countries that received all of their Nobel Prizes between 1906 and 2015.
Australia and Israel are the only 2 countries that received all of their Nobel Prizes between 1906 and 2015 and have received fewer than 15 Nobel Prizes.
Hence, this statement accurately reflects the information in the table.
III.
The latest listed year in the table is the year 2020.
There are 4 countries in the table that received a Nobel Prize in the year 2020 (France, Germany, United Kingdom, and United States).
The number of Nobel Prizes received by France, Germany, United Kingdom, and United States is 70, 109, 133, and 388 respectively.
Total number of Nobel Prizes received by countries that received a Nobel Prize in the year 2020 = 70 + 109 + 133 + 388 = 700
The earliest listed year in the table is the year 1901.
There are 4 countries in the table that received a Nobel Prize in the year 1901 (France, Germany, Netherlands, and Switzerland).
The number of Nobel Prizes received by France, Germany, Netherlands, and Switzerland is 70, 109, 21, and 27 respectively.
Total number of Nobel Prizes received by countries that received a Nobel Prize in the year 1901 = 70 + 109 + 21 + 27 = 227
Since 700 is not more than four times 227, the number of Nobel Prizes received by countries that received a Nobel Prize in the latest listed year is NOT more than four times the number of Nobel Prizes received by countries that received a Nobel Prize in the earliest listed year.
Hence, this statement does NOT accurately reflect the information in the table.
Yes, Yes, No is the correct combination of the answer choices.
Table Analysis Sample Question 2
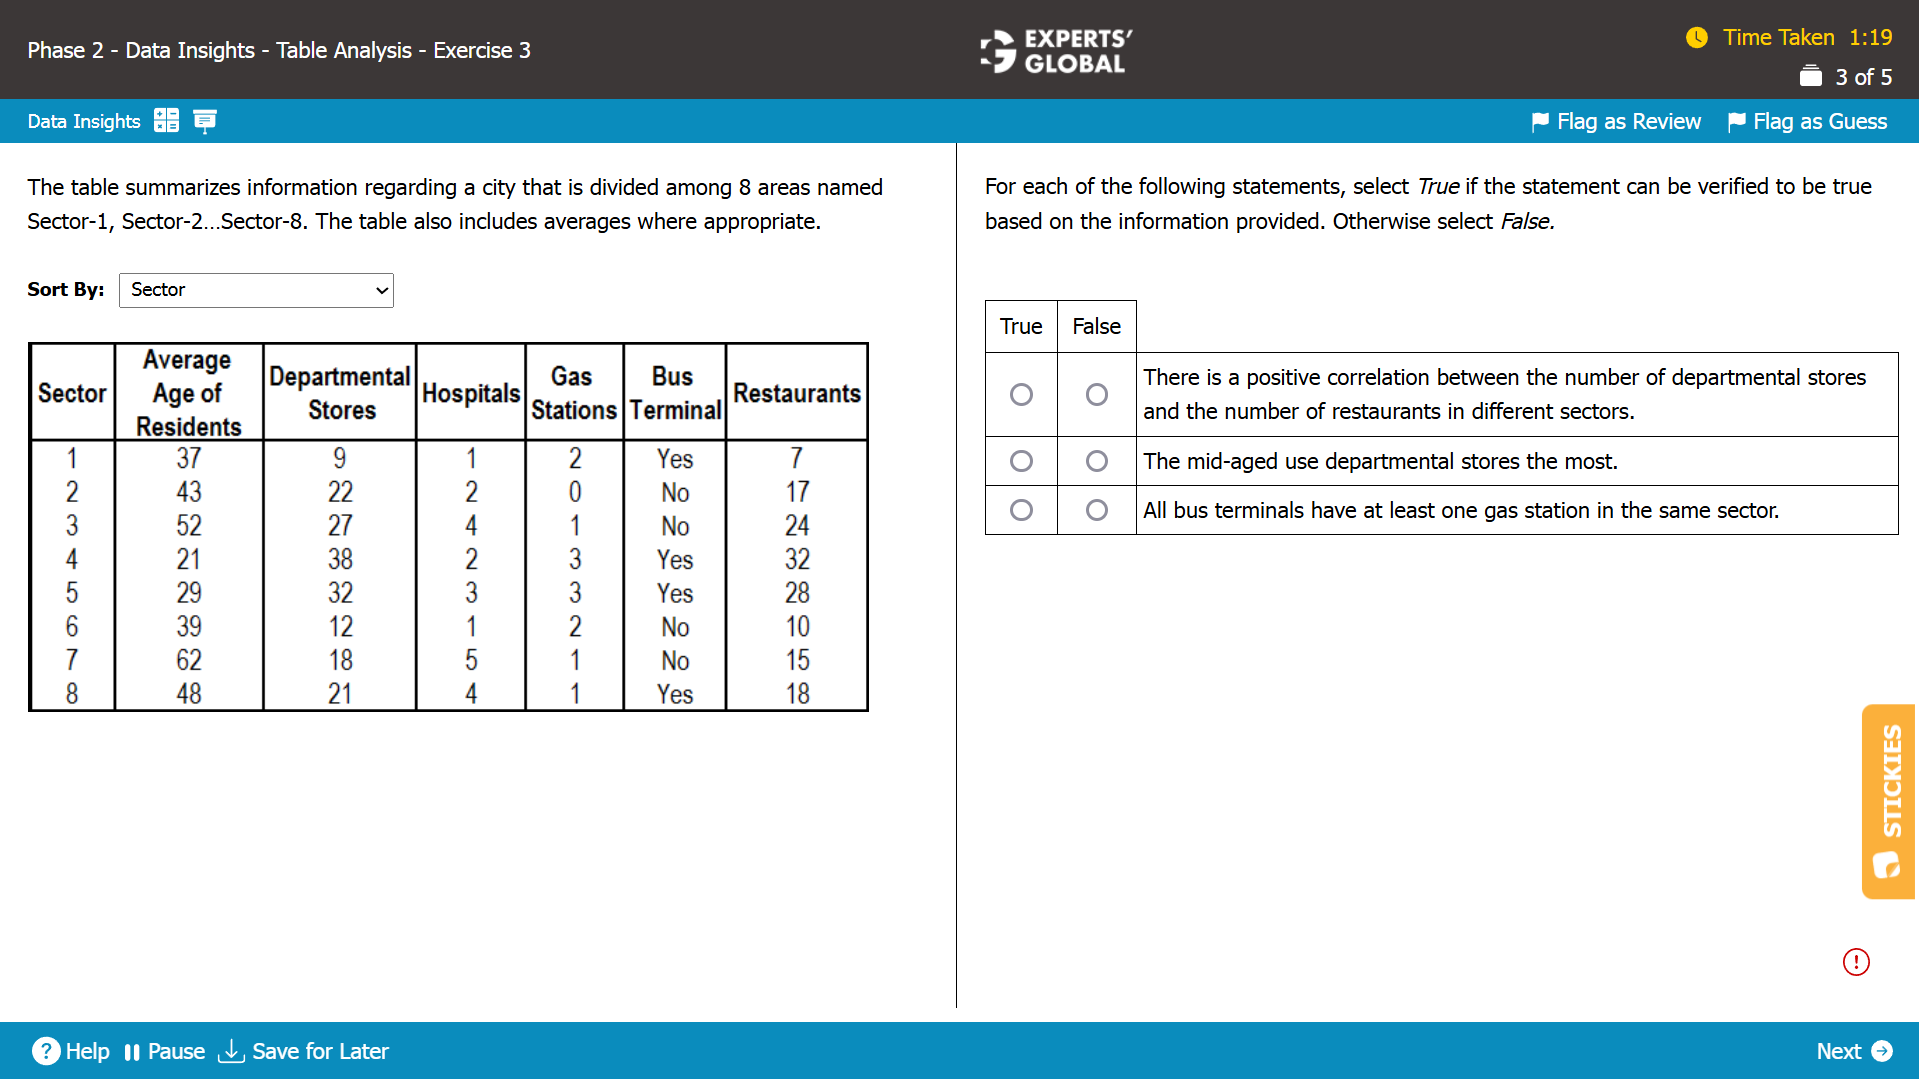
I.
This would suggest that the more the number of departmental stores in a sector, the more the number of restaurants in that sector. This is true.
The statement can be verified to be true.
II.
This would suggest that for the sectors with mid-age average, the number of departmental stores will be the highest. This is not true.
The statement cannot be verified to be true.
III.
This would suggest that there be at least one gas station in sectors that have a bus terminal. This is true.
The statement can be verified to be true.
Hence, True-False-True is the correct answer choice.
Need a comprehensive strategy, approach, and practice for Data Insights questions? Please
click here (you need to be enrolled for a course that includes the DI section).
Table Analysis Sample Question 3
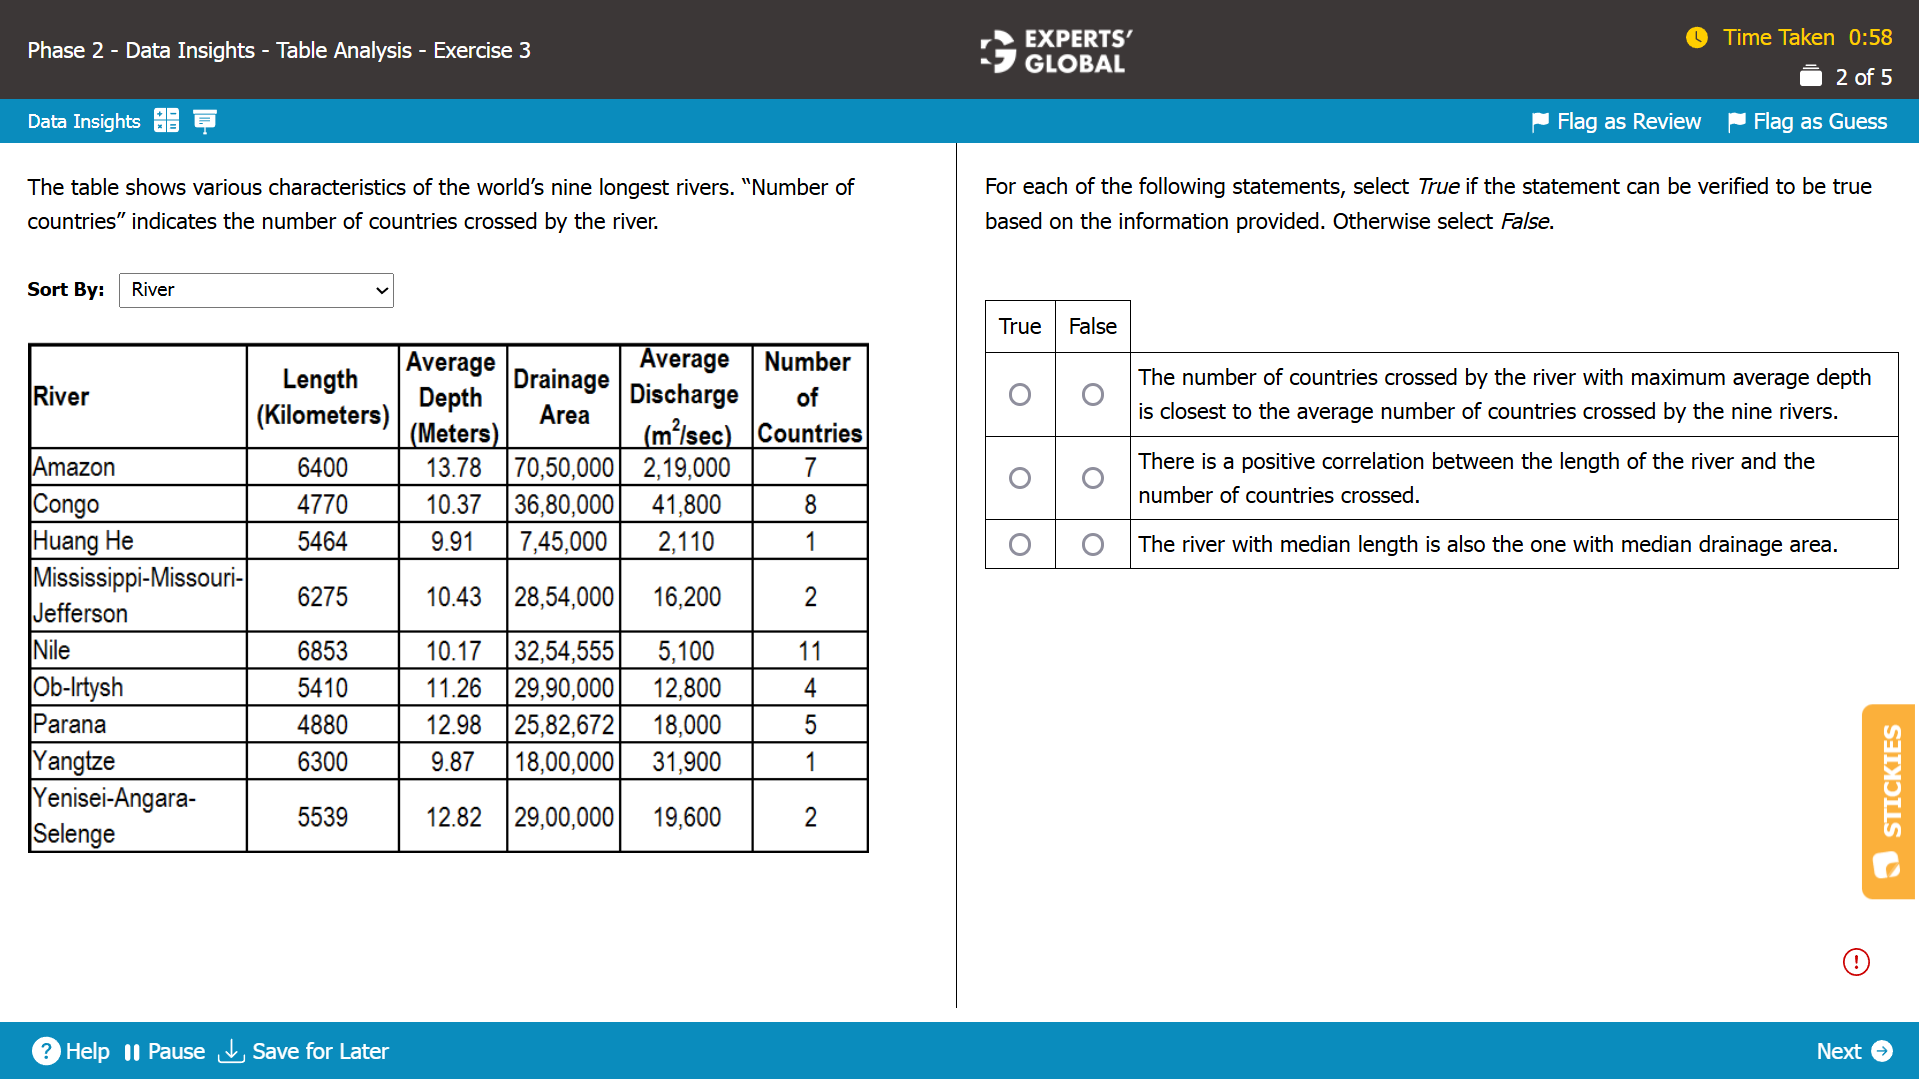
I.
The river with maximum average depth is Amazon, which crosses 7 countries.
The average number of countries crossed by the nine rivers is 4.55.
7 is not closest to 4.55 as there are data points with 4 and 5 countries crossed.
The statement is false.
II.
This would suggest that the longer the river, the more countries it passes. This is not necessarily true.
The statement is false.
III.
The river with median length is Yenisei-Angara-Selenge.
The river with median drainage area is Yenisei-Angara-Selenge.
The statement is true.
Hence,False-False-True is the correct answer choice.
Need a comprehensive strategy, approach, and practice for Data Insights questions? Please
click here (you need to be enrolled for a course that includes the DI section).
Table Analysis Sample Question 4
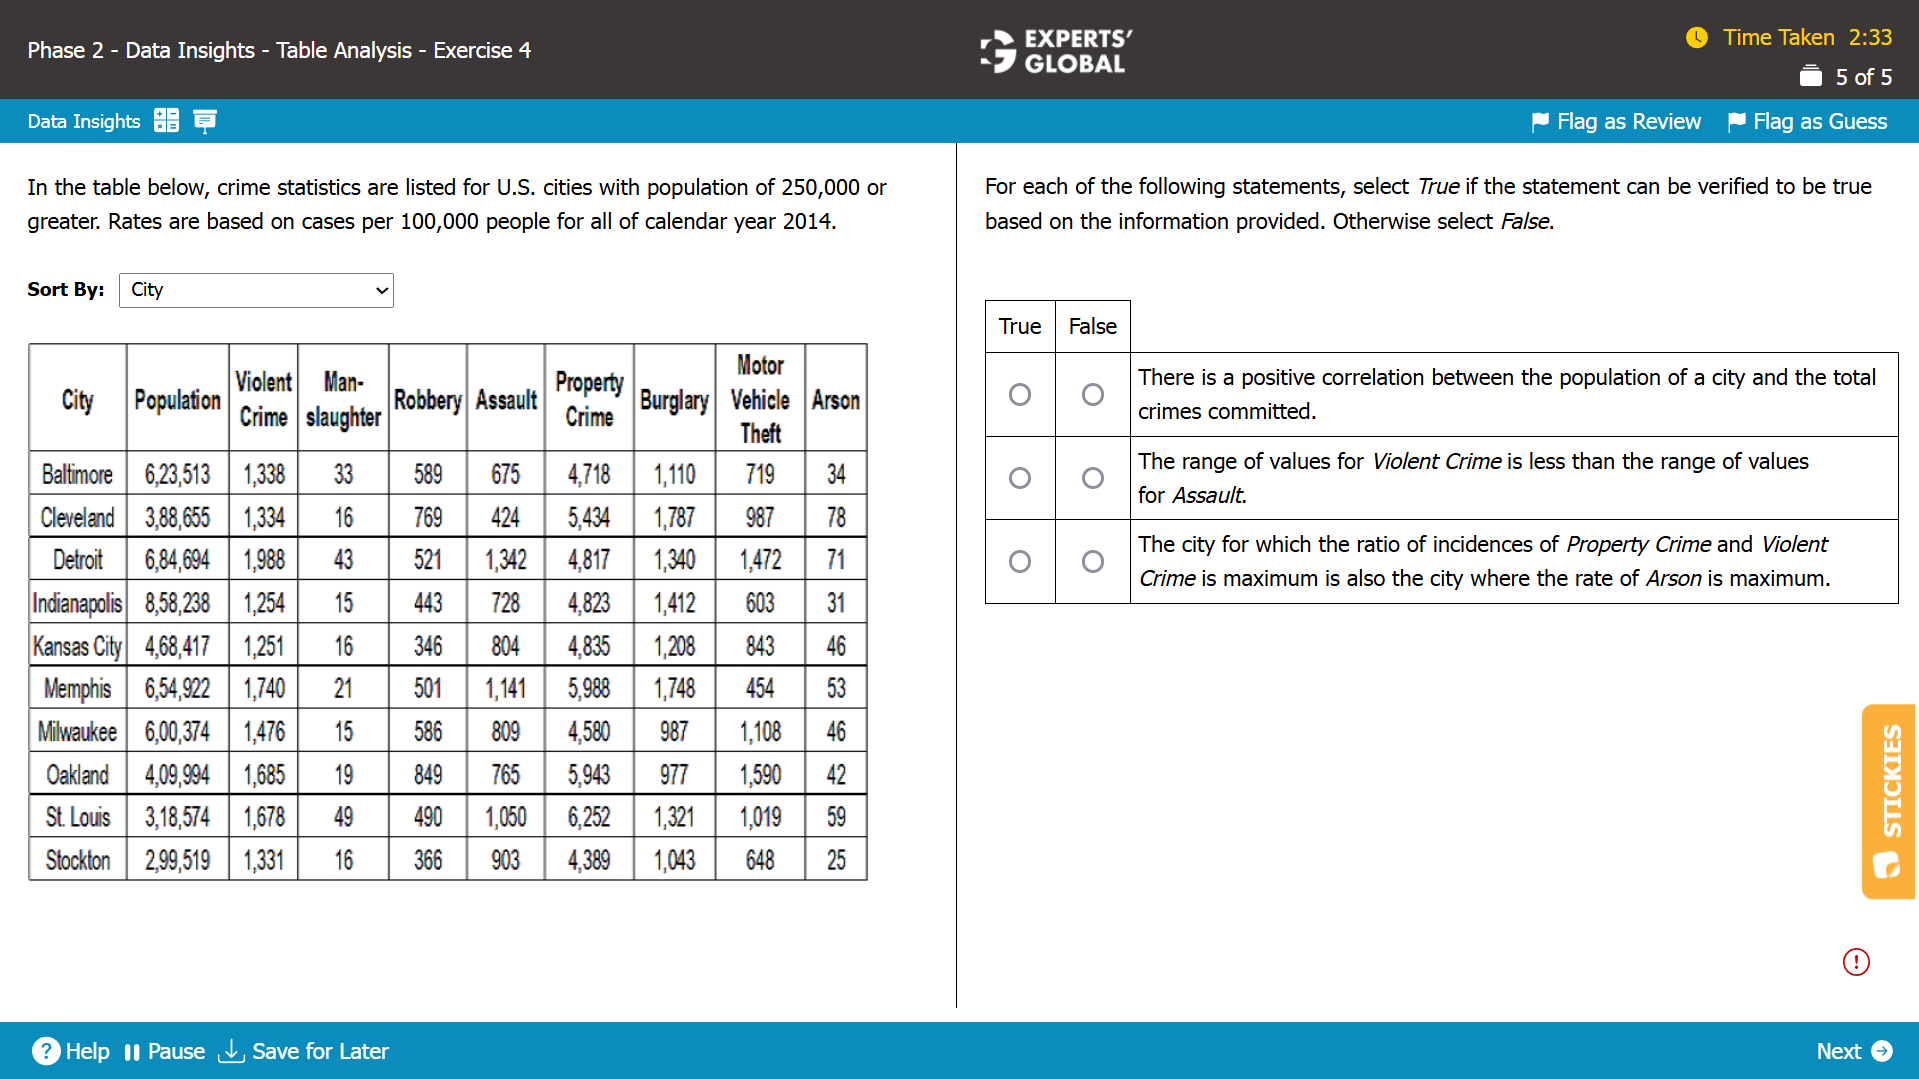
I.
This would mean that the more populated the city, the higher is its crime rate. This is not true. St Louis has the highest crime rate, but not the greatest population.
The statement is false.
II.
The range of values for Violent Crime is 1988–1251 = 737
The range of values forAssault is 1342–424 = 918
The statement is true.
III.
The ratio of incidences of Property Crime and Violent Crime is maximum in Cleveland.
The rate of arson, i.e. Arson/Total Crime, is maximum in Cleveland.
The statement is true.
Hence, False-True-True is the correct answer choice.
Need a comprehensive strategy, approach, and practice for Data Insights questions? Please a href=”../exam/itfmain.php?itfpage=test&actions=stage1-DI-new” target=”_blank” rel=”noopener”>click here (you need to be enrolled for a course that includes the DI section).
Table Analysis Sample Question 5
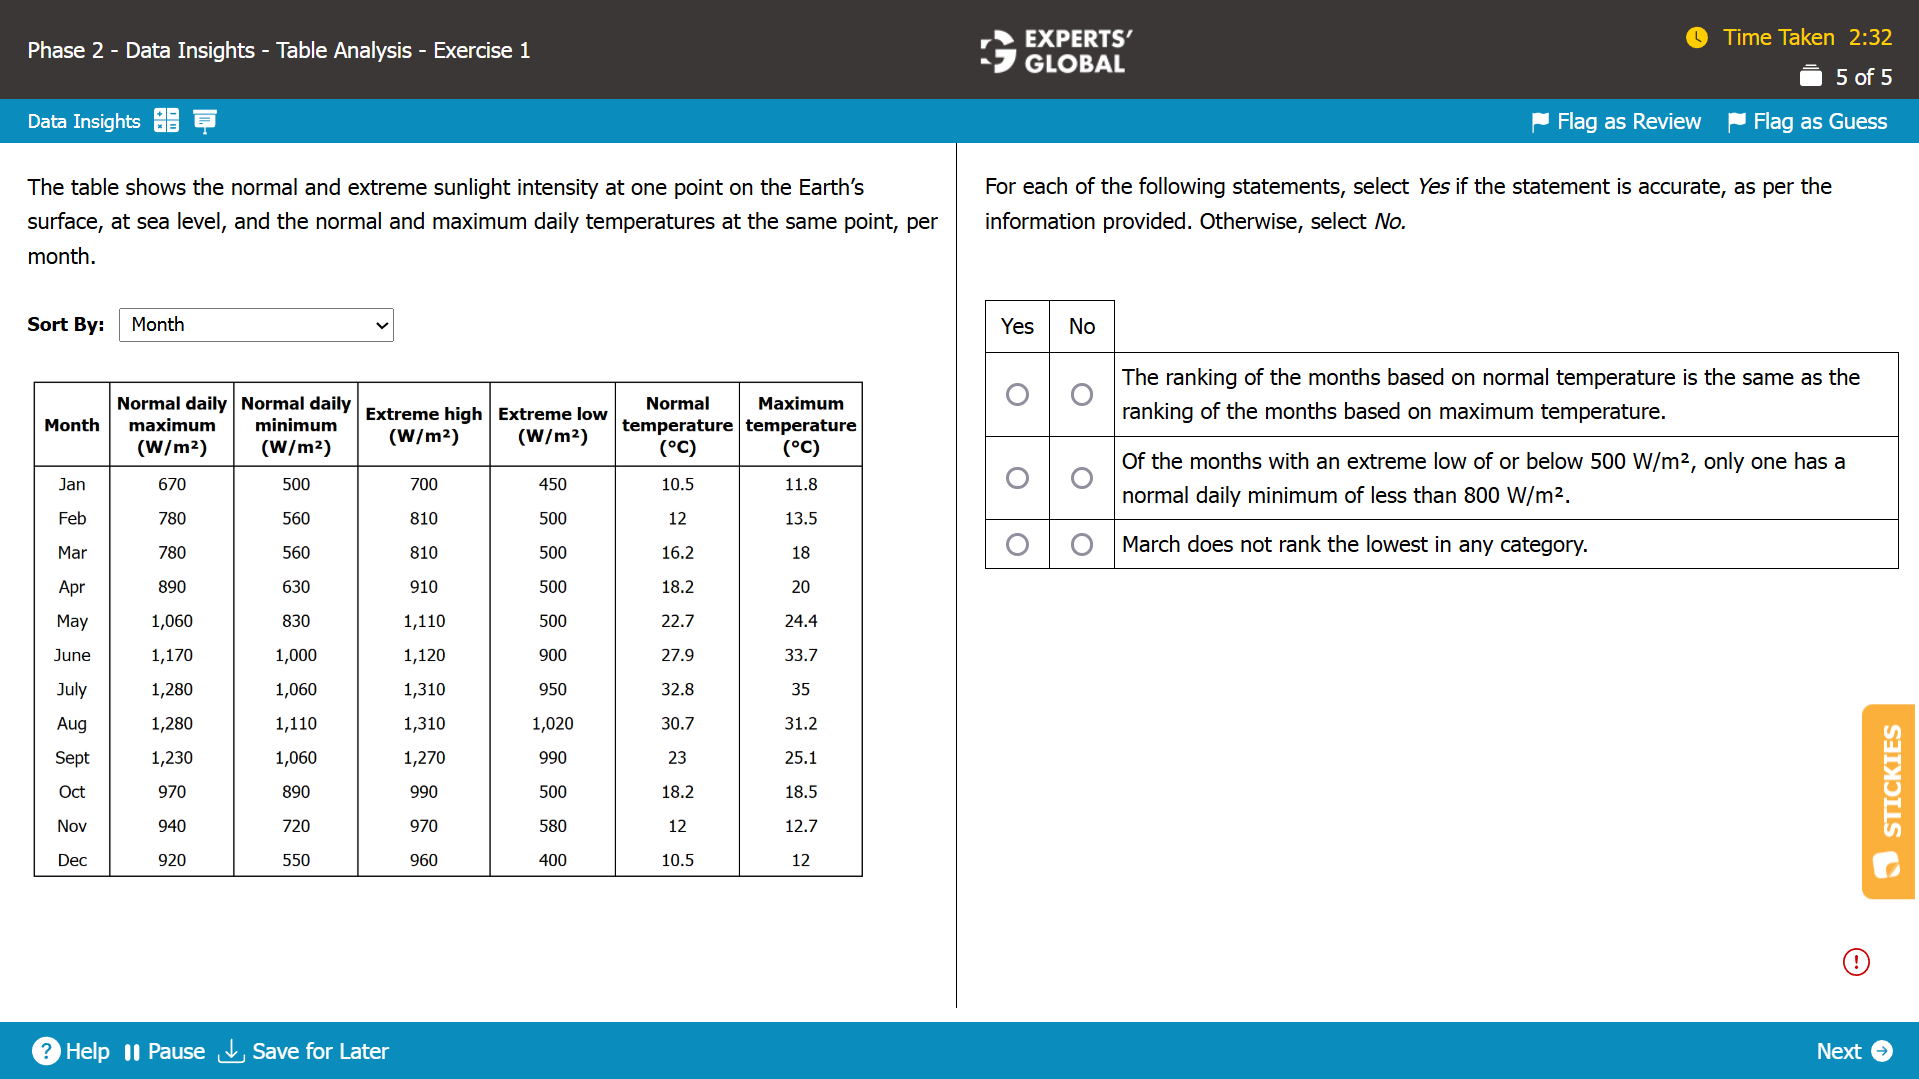
I.
When the months are arranged according to the “Normal Temperature” column and then arranged according to the “Maximum Temperature” column, we see that the order of the months in the “Month” column does not remain the same.
Hence, this statement is NOT accurate, as per the information provided.
II.
There are 5 months listed in the table that have an extreme low of or below 500 W/m², but have a normal daily minimum of less than 800 W/m² (January, February, March, April, and December).
Hence, this statement is NOT accurate, as per the information provided.
III.
March does NOT have the lowest value in any column.
Hence, this statement is accurate, as per the information provided.
No, No, Yes is the correct combination of the answer choices.
Additional TA Sample Questions:
Free GMAT TA prep (includes training videos and additional questions with explanations)
For Further Prep and Practice:
15 full-length GMAT practice tests (includes a free test)
End-to-end GMAT prep course online (includes 7-day free trial)
GMAT 5-weeks crash course
GMAT Prep + Admission Consulting Bundle

