The Data Insights section on the GMAT is one of the three sections on the exam and therefore contributes to one third of your overall score. In addition to this direct contribution, the skills developed while preparing for Data Insights also draw upon concepts and abilities from both the quantitative and verbal sections. For this reason, structured and end to end coverage of all GMAT Data Insights concepts is an essential part of any dependable GMAT preparation course. The GMAT Data Insights section includes multiple question formats, namely data sufficiency (DS), table analysis (TA), two-part analysis (TPA), graphics interpretation (GI), and multi-source reasoning (MSR). Each question presents information through tables, graphics, passages, or statements, followed by answer choices or response options based on the question type. Your task is to carefully analyze the information provided, connect the relevant details, and select the correct response or set of responses based on what the question requires. In data sufficiency, each question has one correct answer choice. In the other Data Insights question types, most questions require multiple responses, and the question is considered correct only when every required response is correct – there are no partial credits.
On this page, we provide a brief introduction to the Data Insights question types that appear on the GMAT and present sample questions organized by question type. These sample questions offer a firsthand experience of how GMAT Data Insights questions appear across different data presentations and reasoning contexts, and how they test your ability to interpret, integrate, and evaluate information. Ensure due learning from this rich resource and apply these learnings in subsequent GMAT drills, GMAT sectional tests, and GMAT full-length mocks. Happy practicing!
Important: Before visiting the DI sample questions, if you would like a quick brush up of key Data Insights concepts, you may first visit: Free GMAT Data Insights Prep
Data Sufficiency (DS) Sample Questions
Data Sufficiency, often referred to as DS, is one of the most interesting question types on the GMAT. Instead of asking you to calculate a final answer, a DS question asks you to judge whether the information provided is sufficient to answer the question. At its core, the GMAT uses this format to measure how calmly and logically you evaluate sufficiency, rather than how quickly you calculate. Out of the 20 questions in the Data Insights section of the GMAT, about 5 to 7 are DS. As you work through the sample DS questions below, do not worry about speed at this stage. Instead, use this opportunity to gain first hand familiarity with the data sufficiency format, flow, user interface, and the layers of logic that shape each question. Keep your focus on engaging carefully with the questions and the reasoning required to arrive at correct answers.
Important: Before visiting the Data Sufficiency sample questions, if you would like a quick brush up of key DS concepts, you may first visit: Free GMAT Data Sufficiency Prep
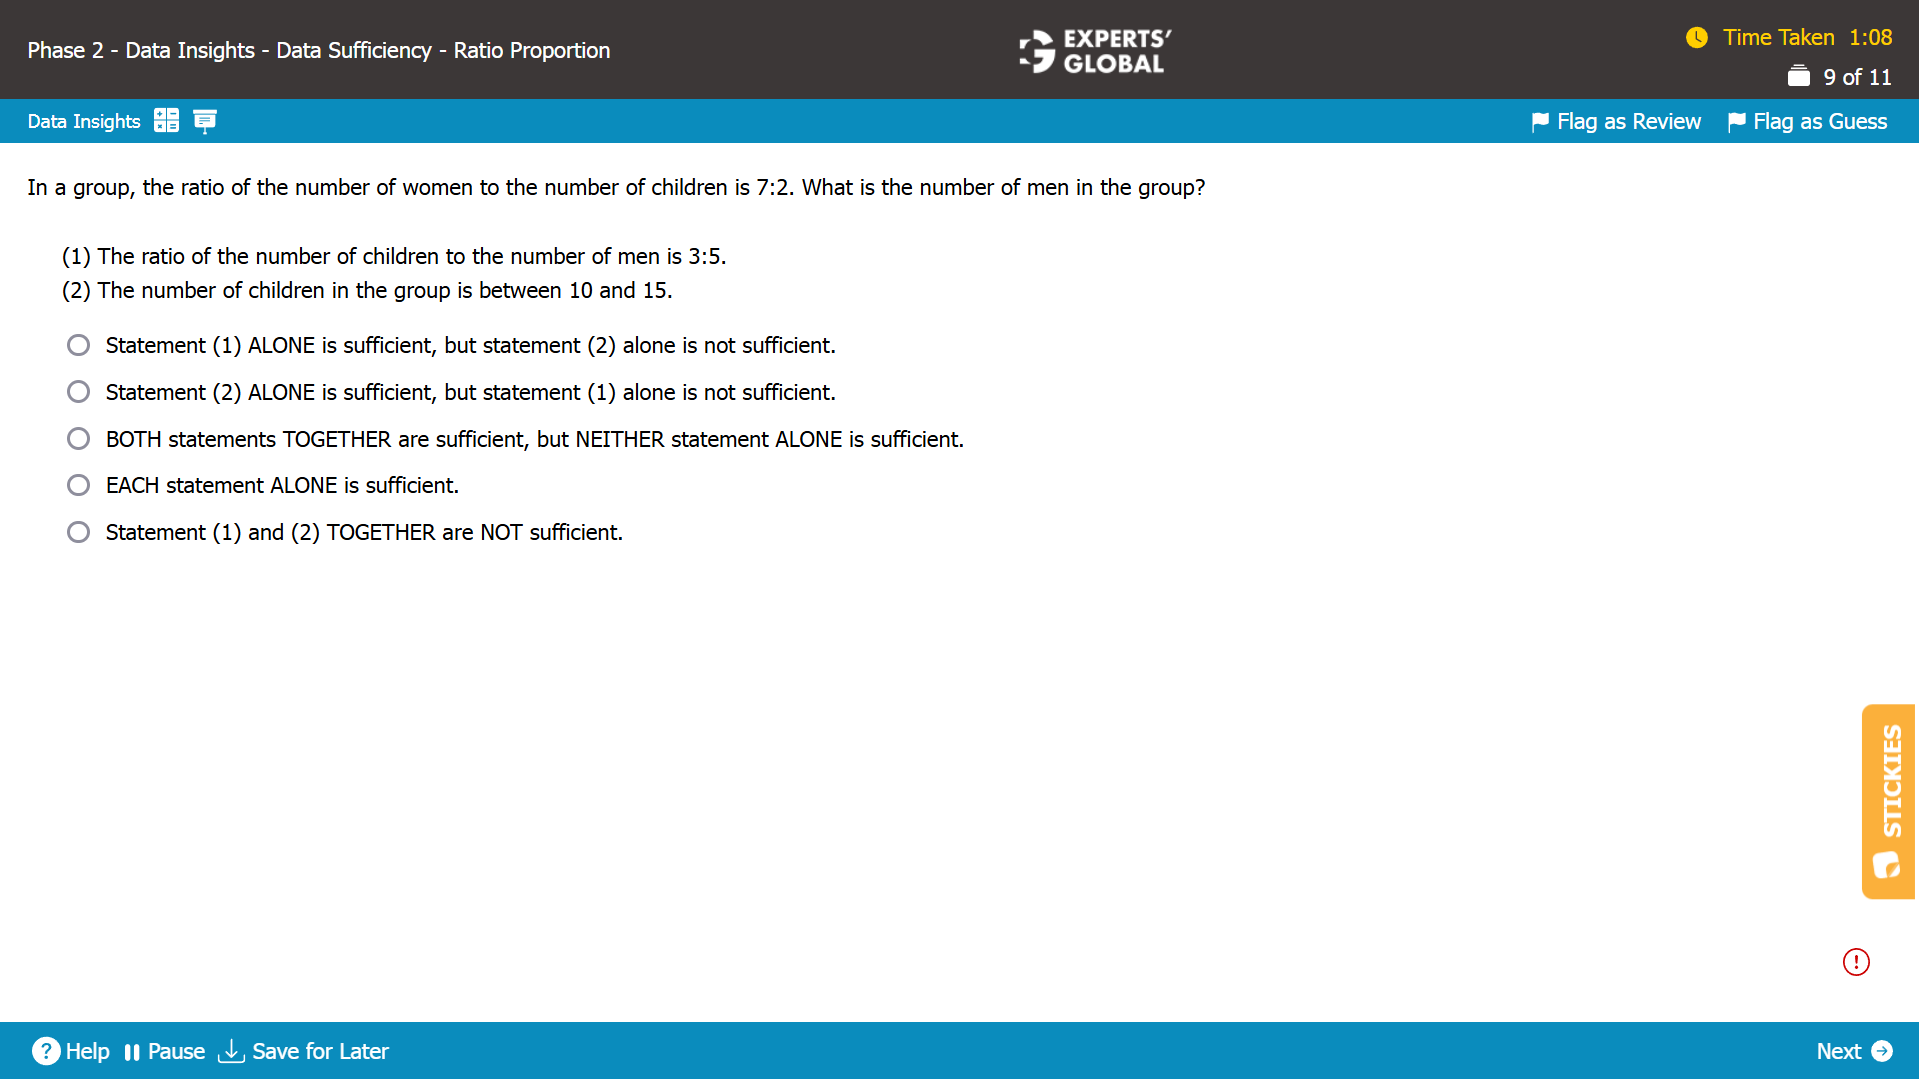
DS Sample Question 1
Written Explanation
Women:Children = 7:2
Statement (1):
Children:Men = 3:5. So, Women:Children:Men = 21:6:10. Insufficient.
Statement (2):
We do not know anything about men, so we cannot determine the number. Insufficient.
Combining both,
Women:Children:Men = 21:6:10 and number of children is between 10 and 15. Considering that we have to deal with whole numbers only, the only combination is 42:12:20. There are 20 men. Sufficient.
Hence, C is the correct answer choice.
Facing difficulty with the approach for Ratio, Proportion, and Variation questions? Please Click here
Facing difficulty with the approach for data sufficiency questions? Please Click here
Need a comprehensive strategy, approach, and practice for Ratio, Proportion, and Variation questions? Please Click here (you need to be enrolled for a course that includes the Quant section).
Need a comprehensive strategy, approach, and practice for data sufficiency questions? Please Click here (you need to be enrolled for a course that includes the Quant section).
DS Sample Question 2
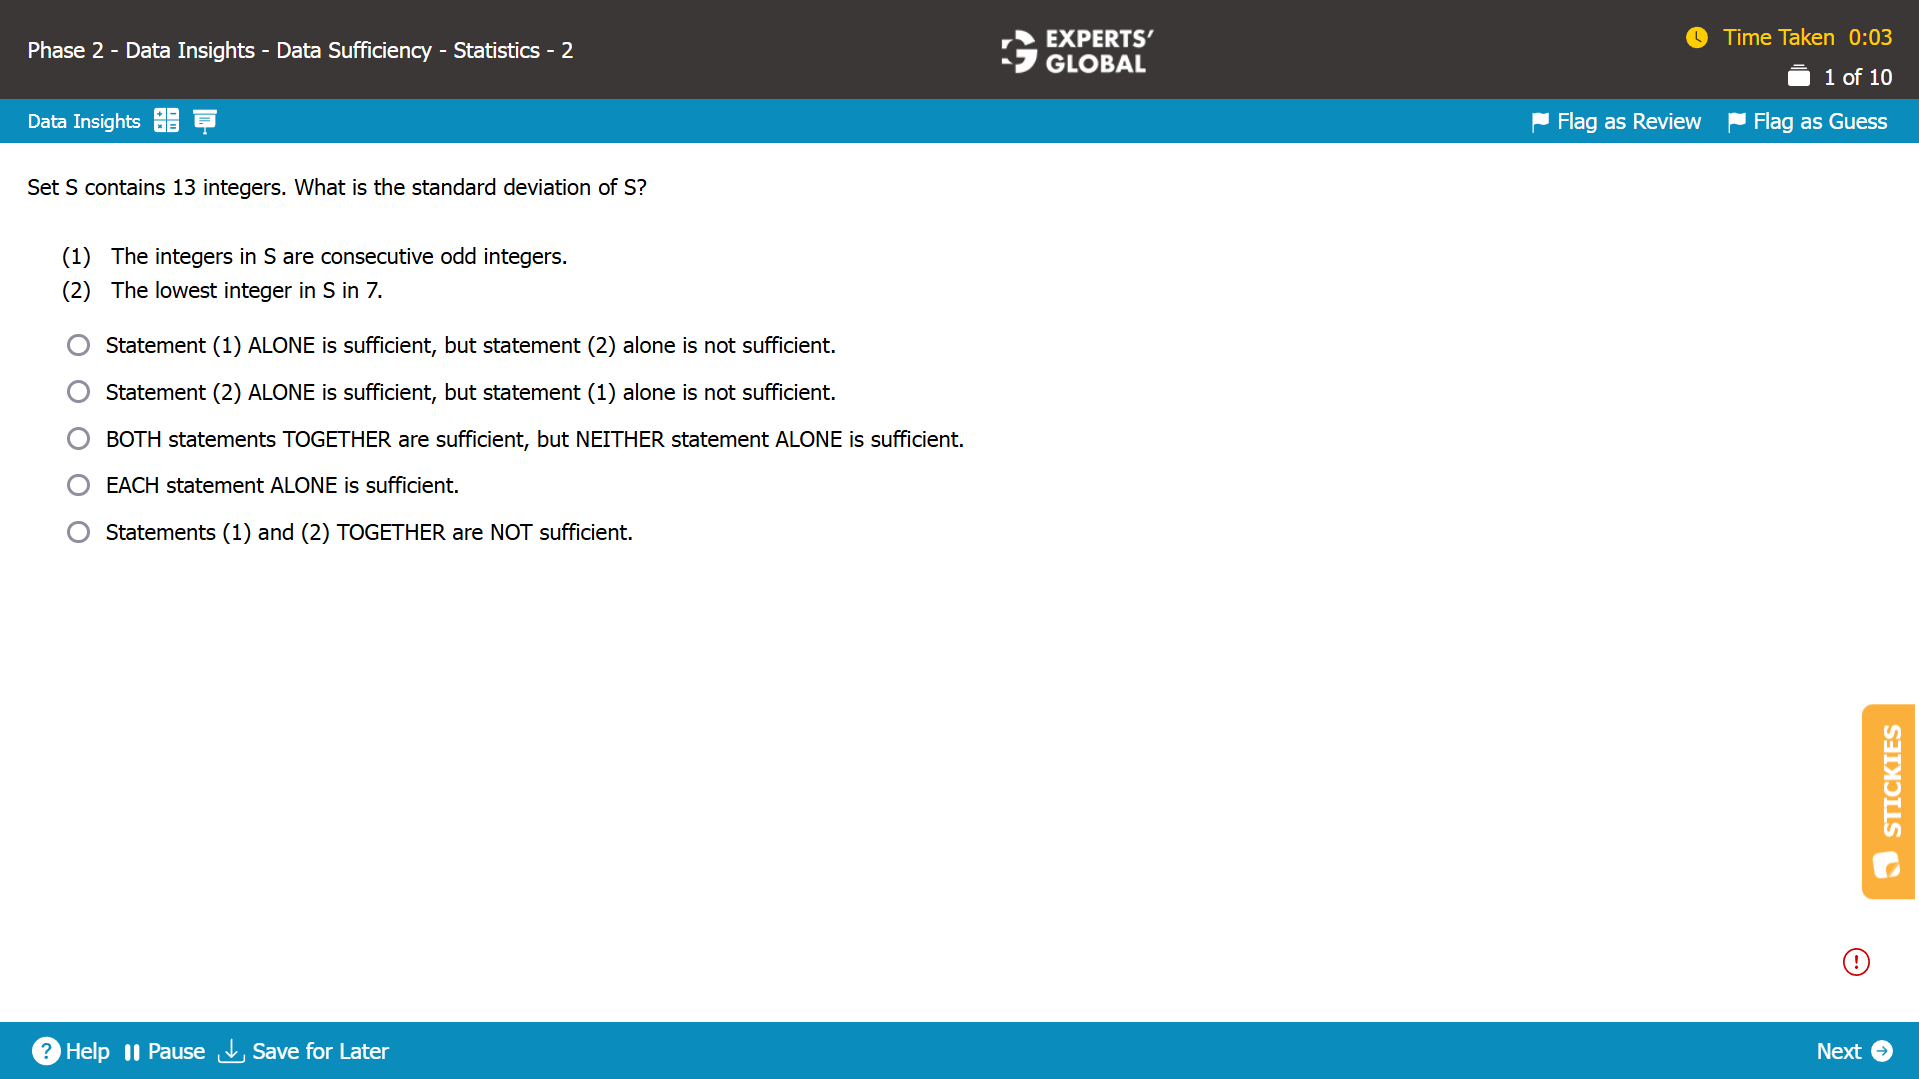
Written Explanation
Statement (1):
The set is of the form a,a+1,a+2….a+12. We can calculate the standard deviation. Sufficient.
Statement (2):
We do not know about other elements in the set. Insufficient.
Hence, A is the correct answer choice.
DS Sample Question 3
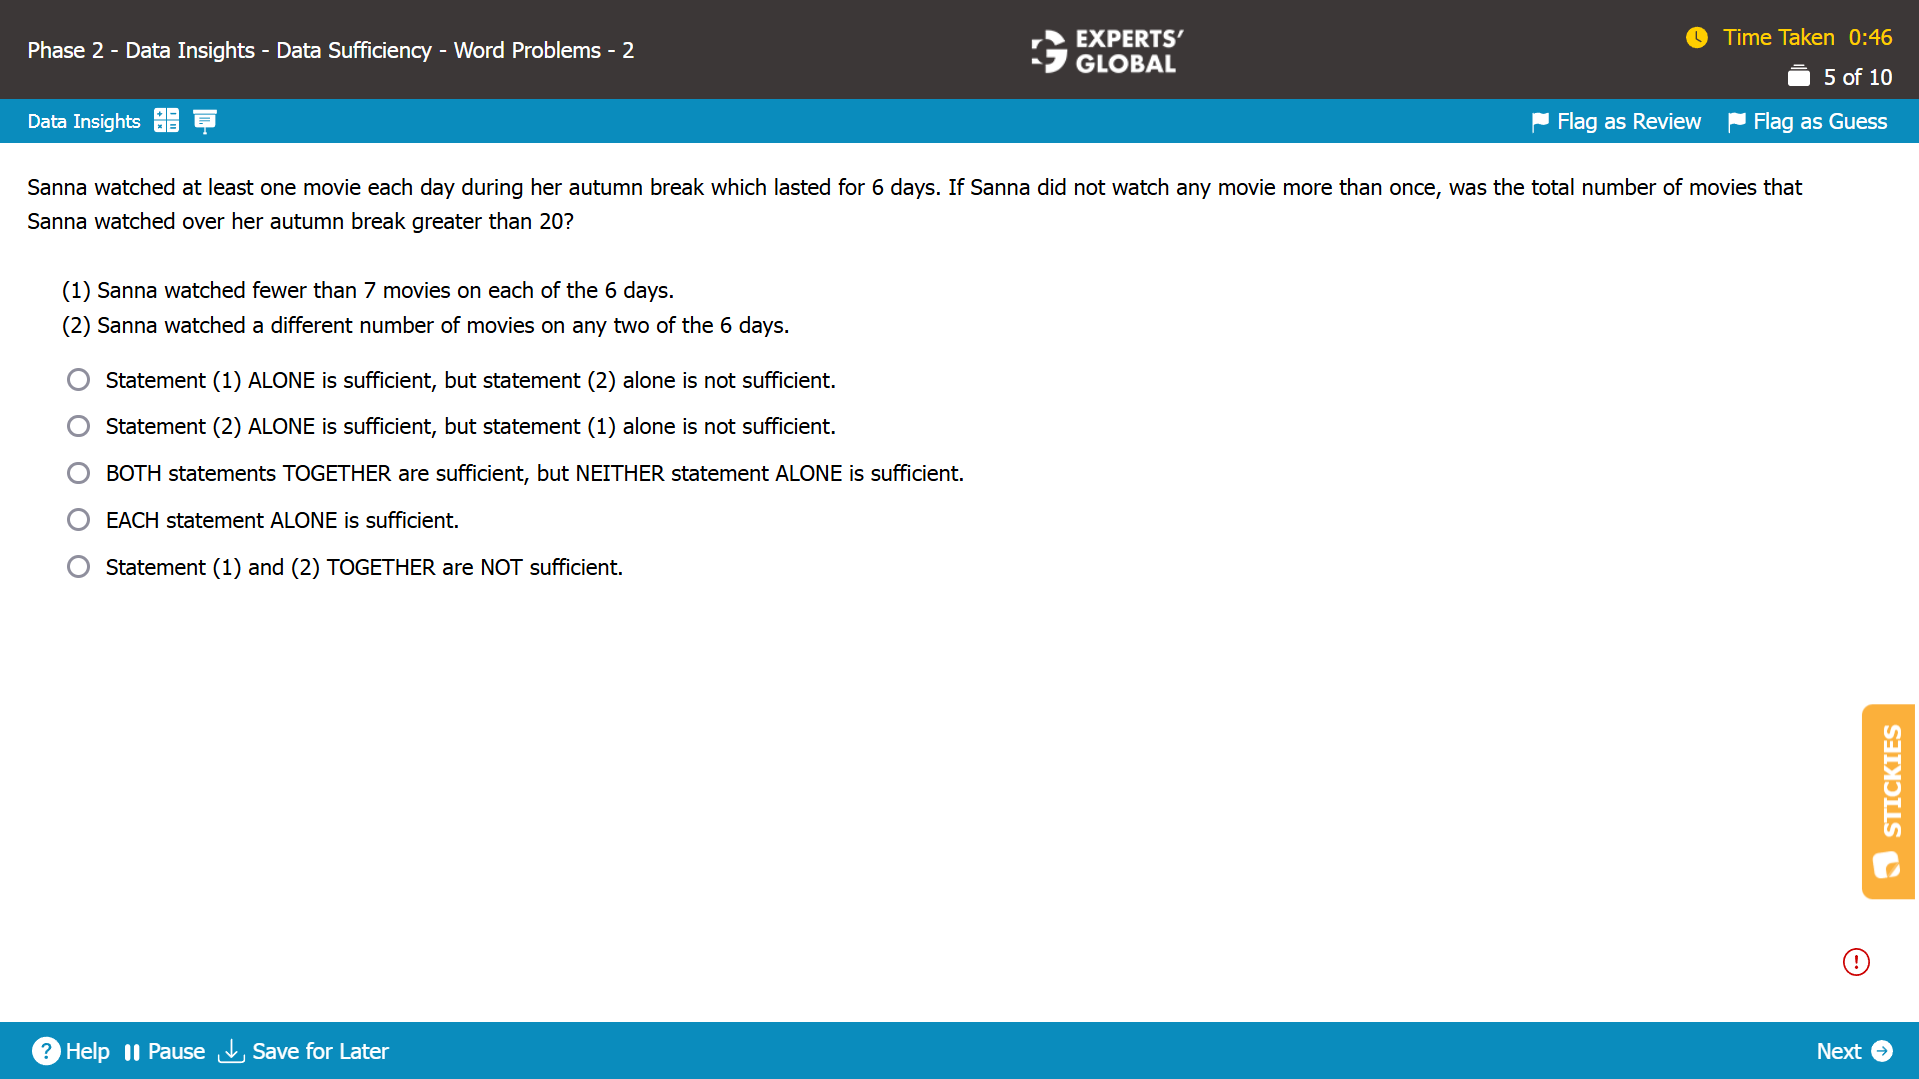
The total number of days = 6
The number of movies watched each day is at least 1.
We need to find whether the total number of movies watched is greater than 20.
Statement (1)
Sanna watched fewer than 7 movies on each of the 6 days.
Possibility 1:If Sanna watched 1 movie each day, then the total number of movies watched = 6 × 1 = 6 < 20.
Possibility 2:If Sanna watched 6 movies each day, then the total number of movies watched = 6 × 6 = 36 > 20.
It is NOT possible to determine whether the total number of movies watched is greater than 20. Hence, Statement (1) is insufficient.
Statement (2)
Sanna watched a different number of movies on any two of the 6 days.
Minimum possible number of movies watched= 1 + 2 + 3 + 4 + 5 + 6 = 21 > 20.
It is possible to determine that the total number of movies watched is greater than 20. Hence, Statement (2) is sufficient.
B is the correct answer choice.
DS Sample Question 4
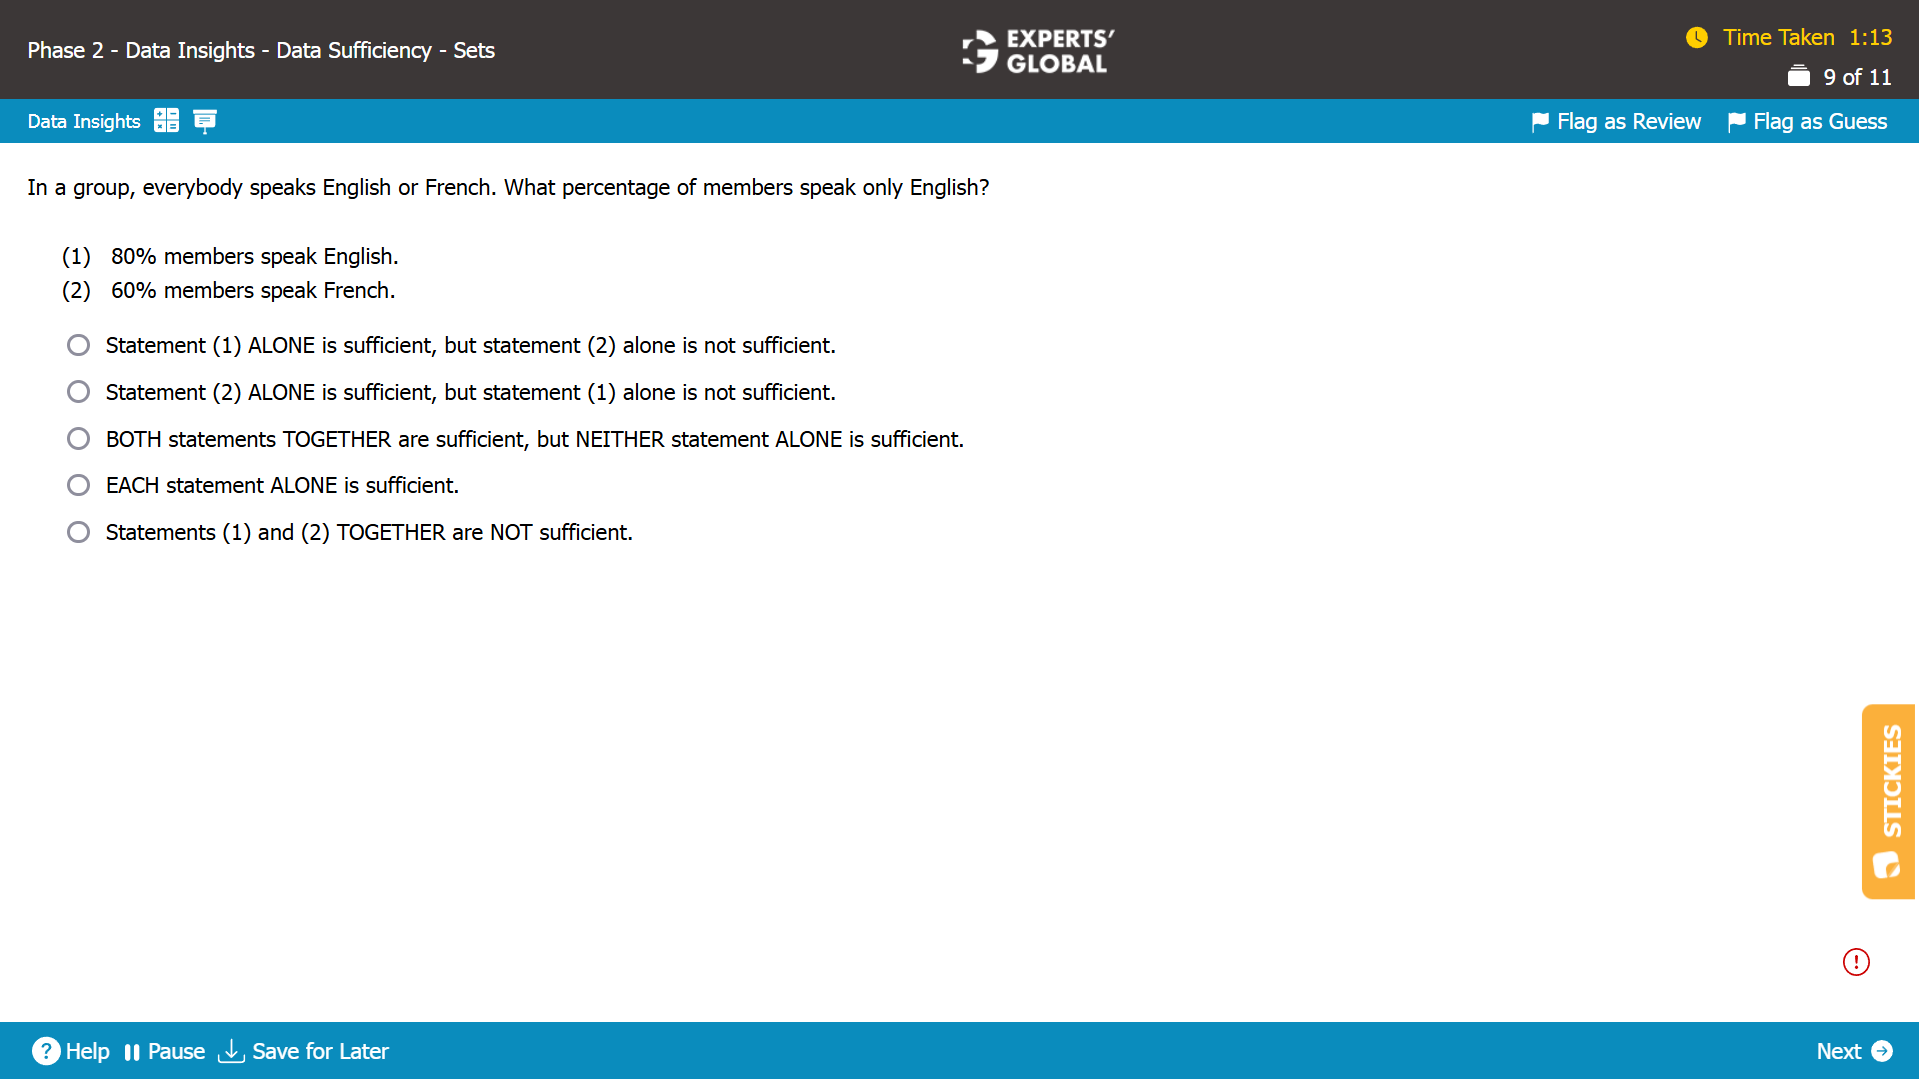
Written Explanation
A = Percentage of people who speak only English
B = Percentage of people who speak both English and French
C = Percentage of people who speak only French
A + B + C = 100%
A needs to be determined.
Statement (1)
80% speak English.
A + B = 80.
A cannot be determined. Insufficient.
Statement (2)
60% speak French.
B + C = 60.
A + B + C = 100%
So, A = 100 – 60 = 40%.
A can be determined. Sufficient.
B is the correct answer choice.
DS Sample Question 5
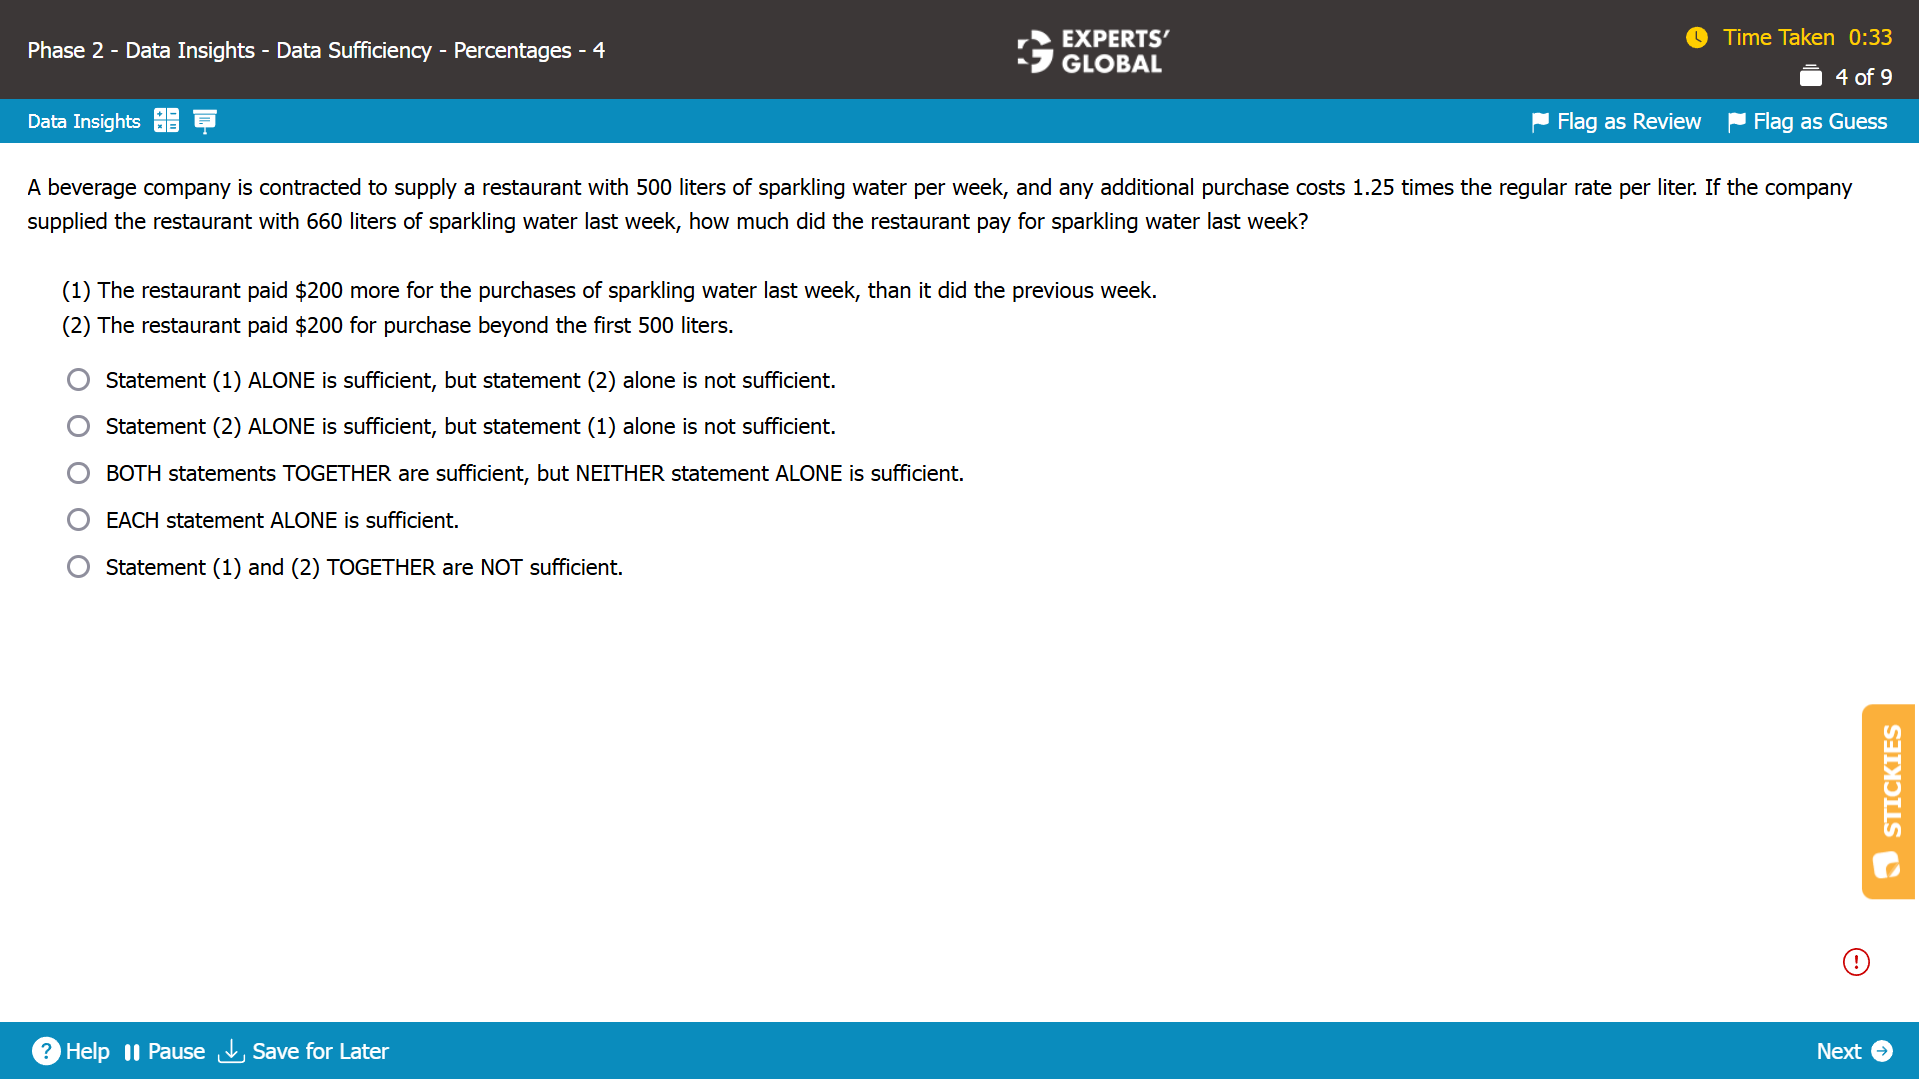
Let the regular cost of sparkling water per liter be C.
Cost for the first 500 liters of sparkling water = 500C
Cost per liter for any additional sparkling water beyond the initial 500 liters = 1.25C
Cost for 660 liters of sparkling water = Cost for the first 500 liters + Cost for 160 additional liters = 500C + (160 × 1.25C)
We need to find whether the value of 500C + (160 × 1.25C) can be determined.
Statement (1)
The restaurant paid $200 more for the purchases of sparkling water last week, than it did the previous week.
Since no information about the number or the cost of purchases in the previous week is provided, it is NOT possible to determine with certainty the amount paid by the restaurant for sparkling water last week. Hence, Statement (1) is insufficient.
Statement (2)
160 × 1.25C = 200
Since it is possible to determine the exact value of C, it is also possible to determine the exact amount paid by the restaurant for sparkling water last week. Hence, Statement (2) is sufficient.
B is the correct answer choice.
Table Analysis (TA) Sample Questions
Table Analysis, often referred to as TA, is one of the most distinctive and engaging question types on the GMAT. Instead of asking you to decide whether information is sufficient, a TA question asks you to interpret information presented in a table and judge which responses are supported by the data shown. The GMAT uses this format to measure how calmly and logically you work through structured data, rather than how quickly you move through the table. Out of the 20 questions in the Data Insights section of the GMAT, about 3 are TA. As you work through the sample TA questions below, do not worry about speed at this stage. Instead, use this opportunity to gain first hand familiarity with the table analysis format, flow, user interface, and the layers of logic that shape each question. Keep your focus on engaging carefully with the questions and the reasoning required to arrive at correct answers.
Important: Before visiting the Table Analysis sample questions, if you would like a quick brush up of key TA concepts, you may first visit: Free GMAT Table Analysis Prep
TA Sample Question 1
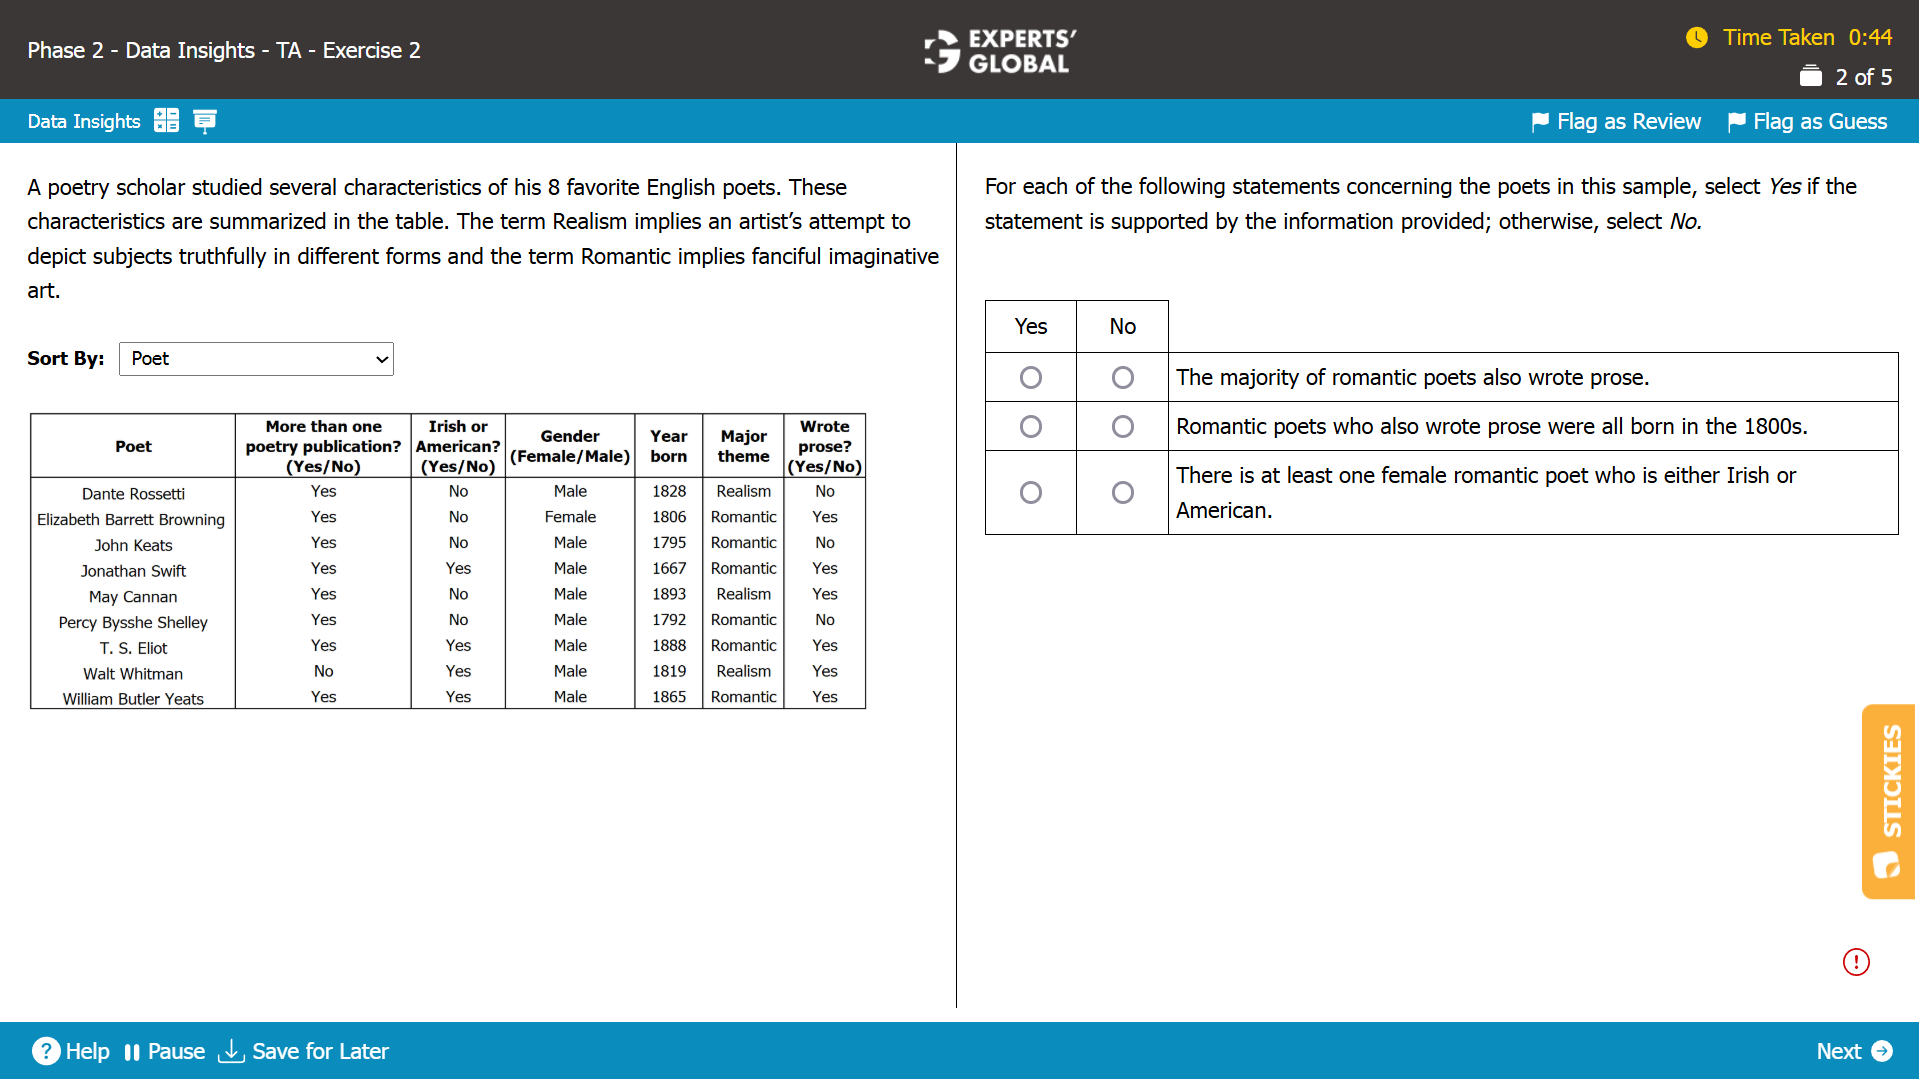
I.
From the “Major theme” column, we see that there are 6 romantic poets listed in the table.
From the “Wrote Prose?” column, we see that 4 out of these 6 romantic poets also wrote prose.
Hence, this statement is supported by the information provided.
II.
Jonathan Swift is a romantic poet who wrote prose, but was NOT born in the 1800s.
Hence, this statement is NOT supported by the information provided.
III.
From the “Gender” column, we see that there is only one female poet listed in the table.
From the “Irish or American?” column, we see that she is NOT Irish or American.
Hence, this statement is NOT supported by the information provided.
Yes, No, No is the correct combination of the answer choices.
TA Sample Question 2
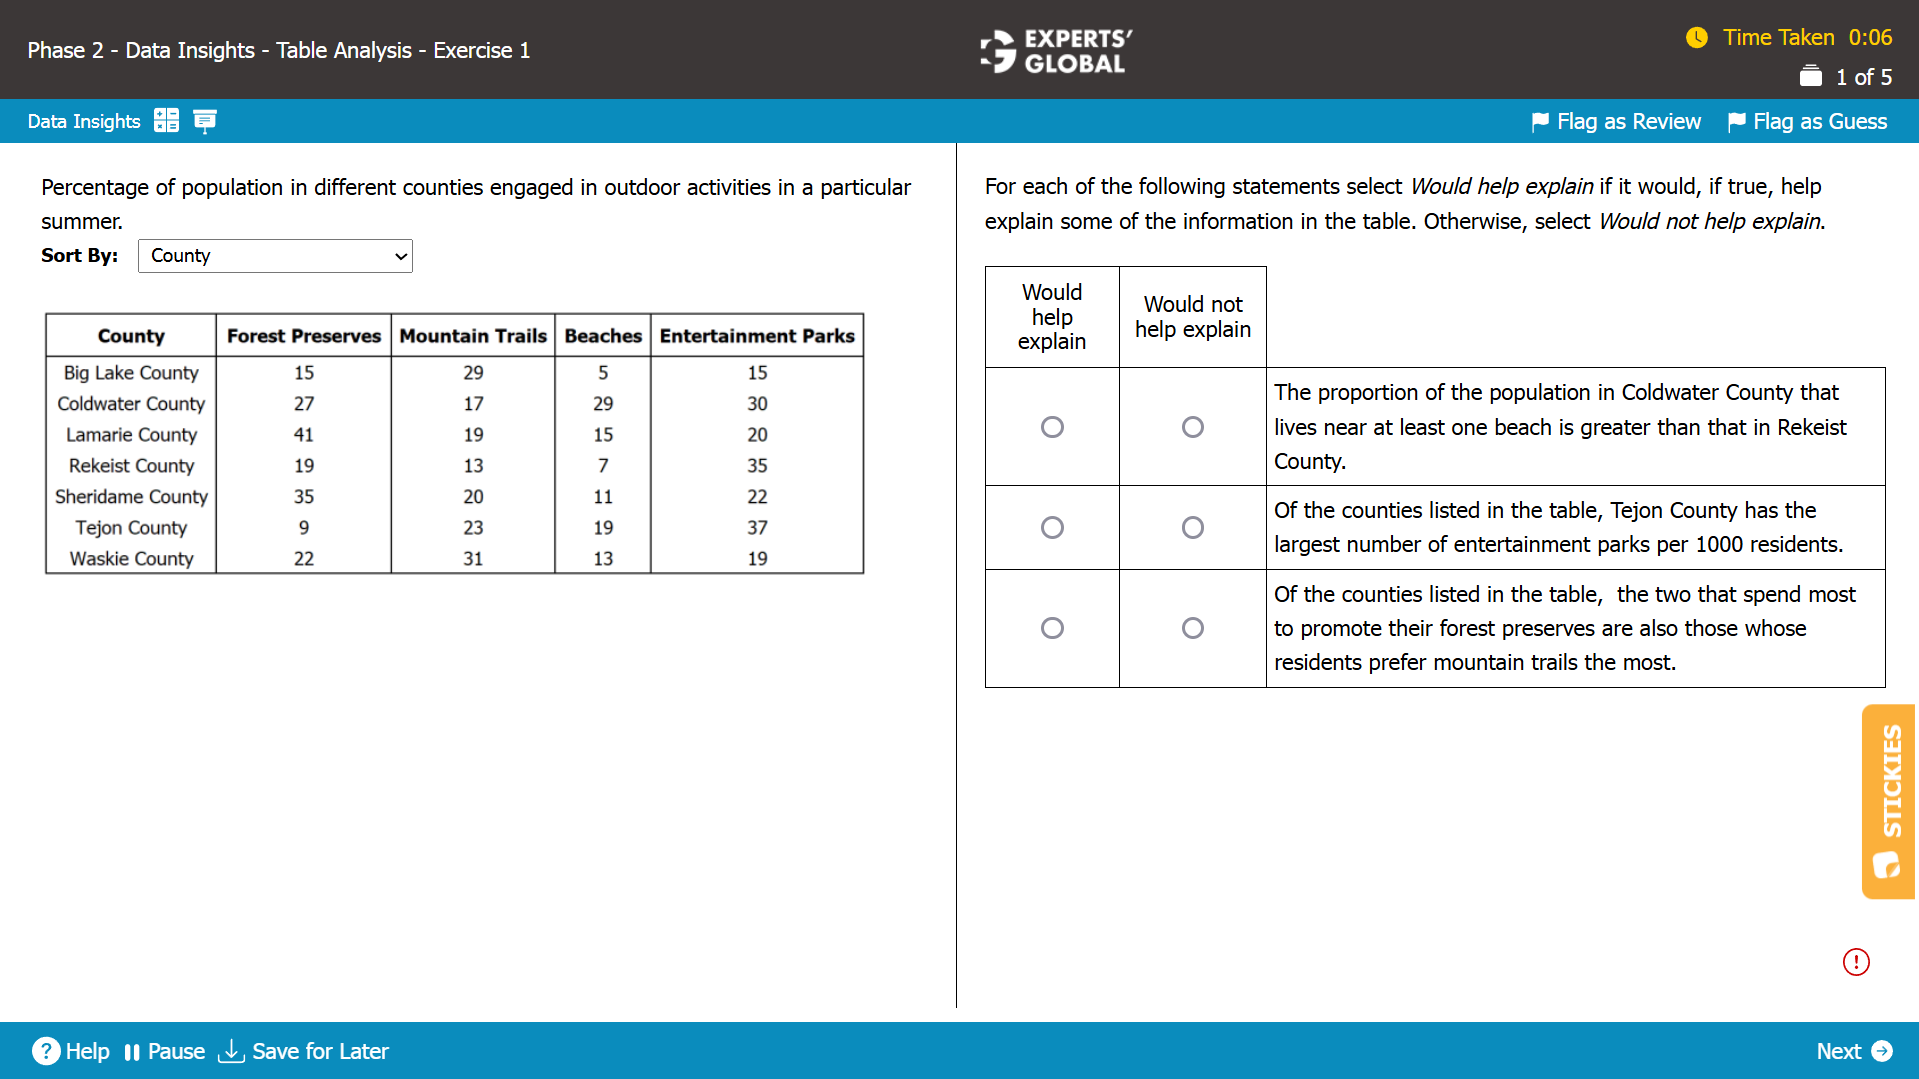
I.
According to the table, 29 percent of the population of Coldwater County visited the beach over this particular summer, while only 7 percent of the population did so in Rekeist County; if more people in Coldwater County live near a beach than do in Rekeist County, it can reasonably be said that this fact is one reason why a greater proportion of the population visited beaches in Coldwater County than in Rekeist County.
Thus, this statement helps explain information presented in the table.
II.
According to the table, 37 percent of the population of Tejon County visited entertainment parks over this particular summer, the highest of such figures for all counties listed in the table; if Tejon County has the greatest proportion of entertainment parks to residents among the listed counties, it can reasonably be said that this fact is one reason why a greater proportion of the county’s population visited entertainment parks over this particular summer.
Thus, this statement helps explain information presented in the table.
III.
According to the table, since Lamarie and Sheridame Counties had the highest proportion of their respective populations visit forest preserves, they are likely to have spent most in promoting their forest preserves. However, neither of these two counties are among the top two in terms of the percentage of the population that visited mountain trails, suggesting that they are not the two counties whose residents prefer mountain trails the most and therefore, contradicting the statement.
Thus, this statement does not help explain information presented in the table.
Hence, Would help explain, Would help explain, and Would not help explain are the correct answer choices.
Two-Part Analysis (TPA) Sample Questions
Two-Part Analysis, often referred to as TPA questions ask you to make two connected choices that work together to satisfy the question. Out of the 20 questions in the Data Insights section of the GMAT, about 4 to 5 are TPA. As you work through the sample TPA questions below, do not worry about speed at this stage. Instead, use this opportunity to gain first hand familiarity with the two-part analysis format, flow, user interface, and the layers of logic that shape each question. Keep your focus on engaging carefully with the questions and the reasoning required to arrive at correct answers.
Important: Before visiting the Two-Part Analysis sample questions, if you would like a quick brush up of key TPA concepts, you may first visit: Free GMAT Two-Part Analysis Prep
TPA Sample Question 1
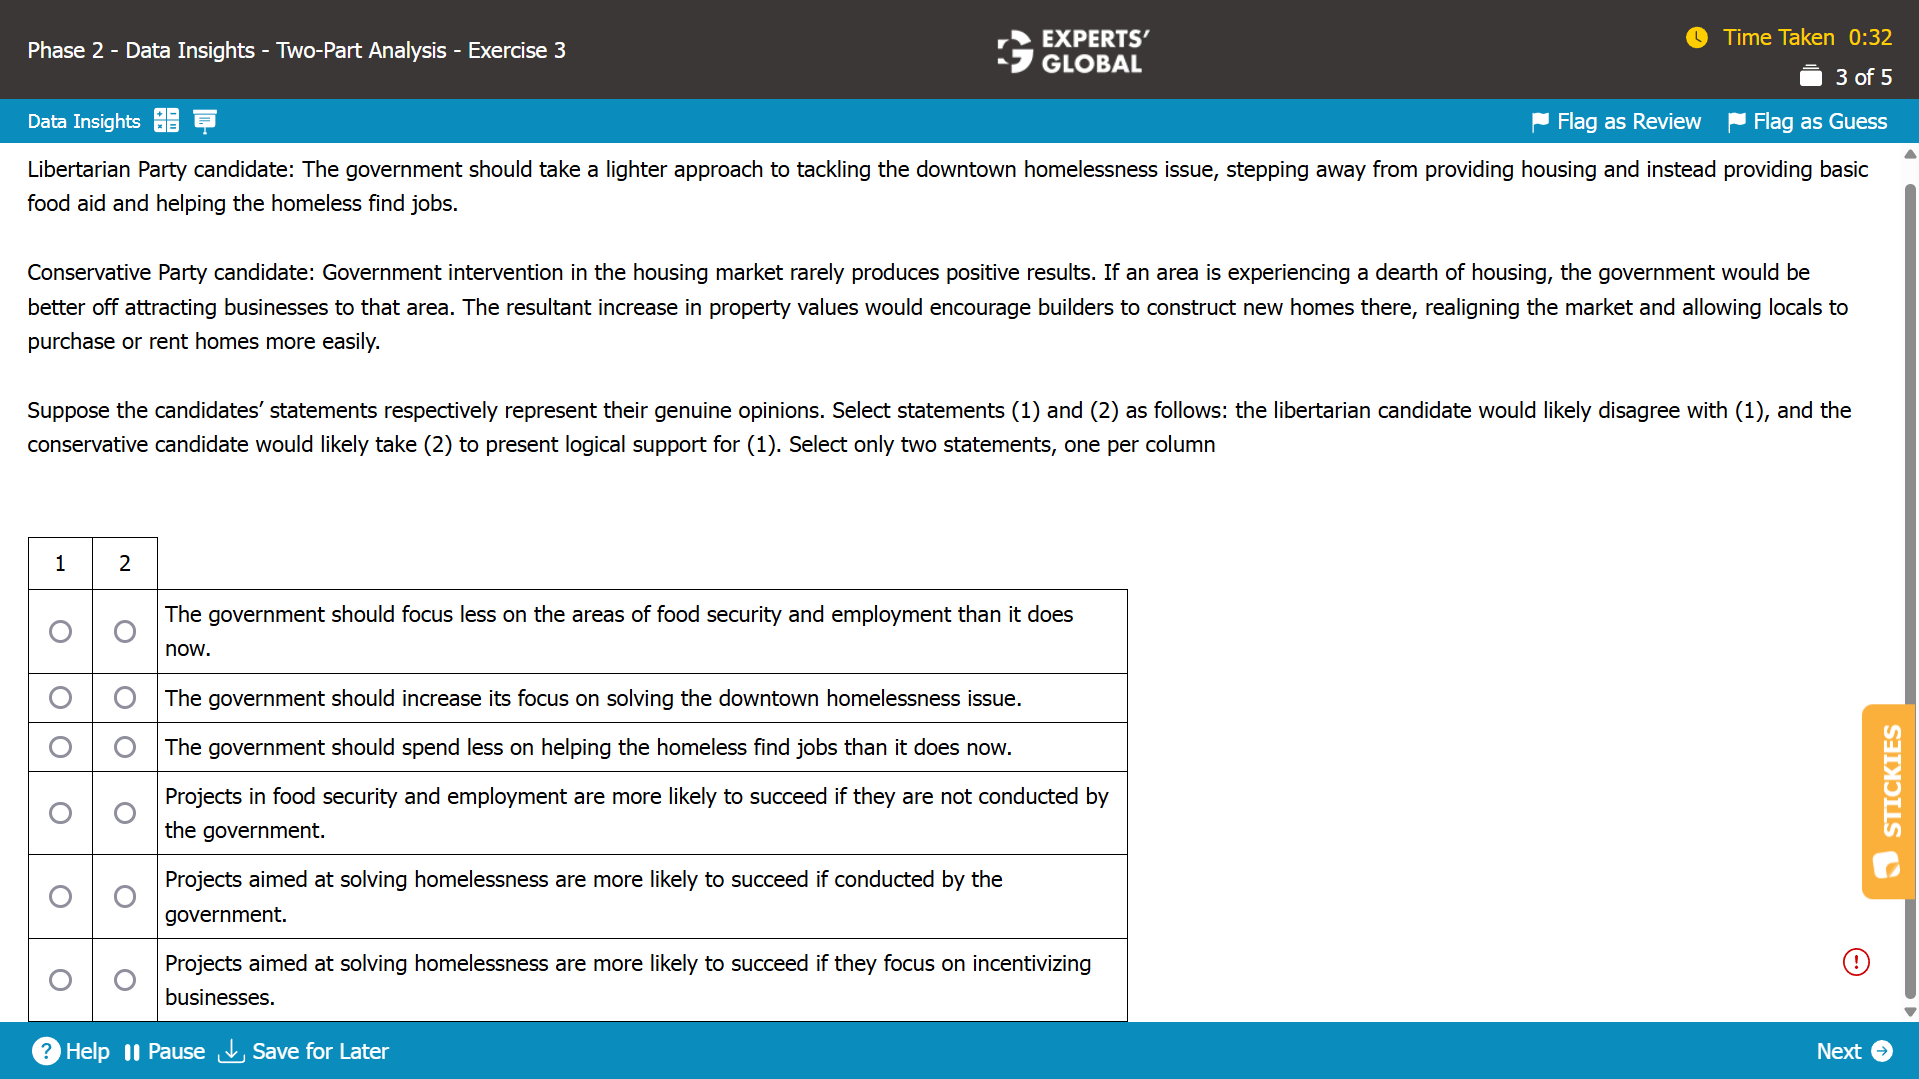
We need to select statements (1) and (2) as follows: the libertarian candidate would likely disagree with (1), and the conservative candidate would likely take (2) to present logical support for (1).
A.
Both candidates propose methods to address the downtown homelessness issue. The candidates’ proposed government actions pertain only to the homeless in a particular location. Neither candidate makes any general statements regarding the sectors on which the government should focus. Hence, this is not the correct answer choice.
B.
Both candidates propose methods to address the downtown homelessness issue. The disagreement between the candidates is not about whether the government should increase its focus on solving the downtown homelessness issue but rather about the approach that should be taken. Hence, this is not the correct answer choice.
C.
The Libertarian Party candidate proposes that the government should help the homeless find jobs to address downtown homelessness. In contrast, the Conservative Party candidate suggests that attracting businesses to the area would be a more effective way to tackle the issue. Thus, we can conclude that the Libertarian Party candidate supports government spending on helping the homeless find jobs, meaning he would disagree with the idea that the government should spend less on helping the homeless find jobs.
Hence, C is the correct answer choice for the 1 column.
D.
The Conservative Party candidate mentions that government intervention in the housing market rarely produces positive results. Neither candidate refers to the likelihood of projects in food security and employment succeeding if they are not conducted by the government. Hence, this is not the correct answer choice for either column, as this statement is irrelevant to the arguments put forth by both candidates.
E.
The Conservative Party candidate mentions that government intervention in the housing market rarely produces positive results, and both candidates propose actions that can be taken by the government to address the downtown homelessness issue. Neither candidate refers to the likelihood of projects aimed at reducing homelessness succeeding if they are not conducted by the government. Hence, this is not the correct answer choice for either column, as this statement is irrelevant to the arguments put forth by both candidates.
F.
The Libertarian Party candidate proposes that the government should help the homeless find jobs to address downtown homelessness. By contrast, the Conservative Party candidate suggests that attracting businesses to the area would be a more effective way to tackle the issue. The Conservative Party candidate also explains that attracting businesses to that area would encourage builders to construct new homes which in turn would allow locals to purchase or rent homes more easily. Thus, we can conclude that the Conservative Party candidate believes that projects aimed at solving homelessness are more likely to succeed if they focus on incentivizing businesses. This statement, in turn, provides logical support for answer choice C – the statement that the government should spend less on helping the homeless find jobs than it does now – as this statement presents an alternative way to address downtown homelessness.
Hence, F is the correct answer choice for the “2” column.
Hence, C is the correct answer choice for the “1” column, and F is the correct answer choice for the “2” column.
TPA Sample Question 2
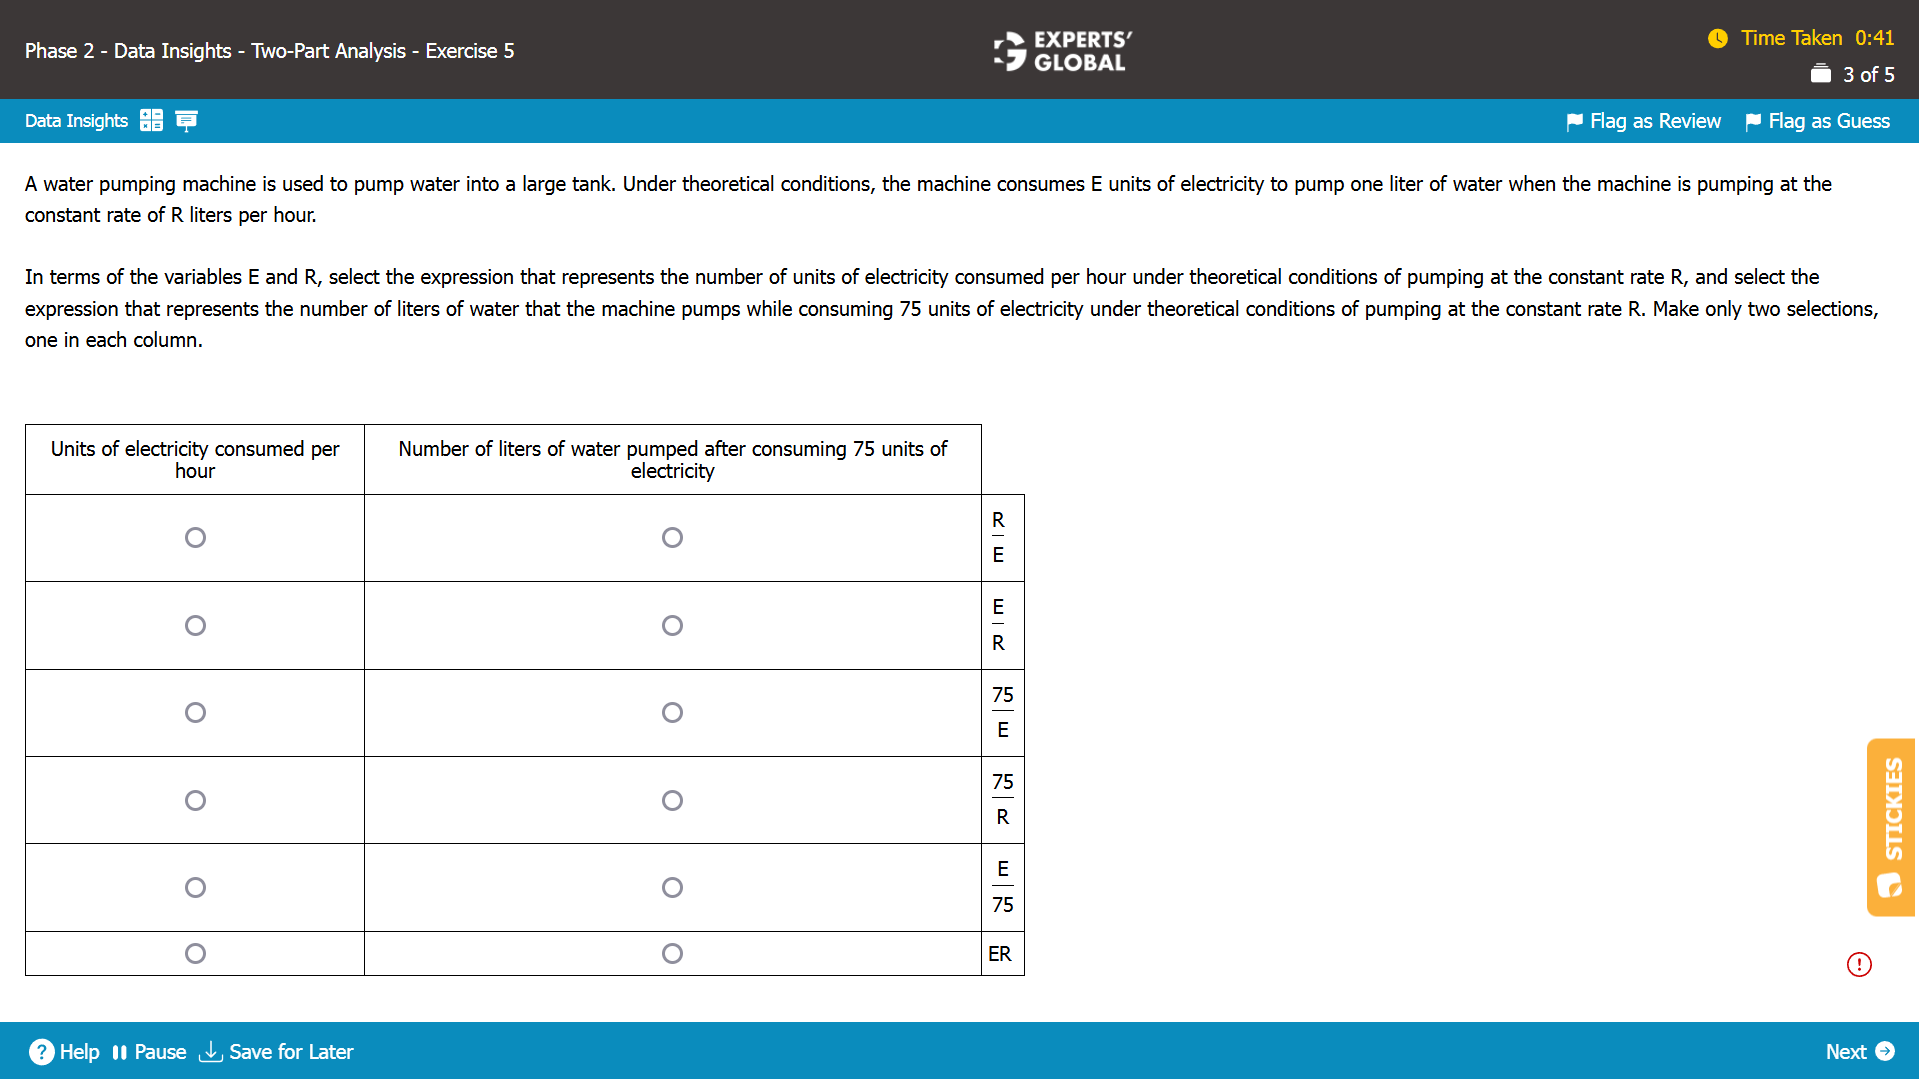
I.
Since the machine pumps water at a rate of R liters per hour, the amount of water pumped in 1 hour = R liters
Amount of electricity consumed to pump 1 liter of water = E
Amount of electricity consumed to pump R liters of water = ER
II.
If E units of electricity are consumed to pump 1 liter of water, then it follows that 1 unit of electricity is consumed to pump 1 / E liter of water.
Thus, the amount of water that the machine pumps while consuming 75 units of electricity = 75 x ( 1 / E ) = 75 / E liters.
Hence, for “Units of electricity consumed per hour column” column, “ER”, and for “Number of liters of water pumped after consuming 75 units of electricity” column, “ 75 / E ” is the correct combination of the answer choices.
TPA Sample Question 3
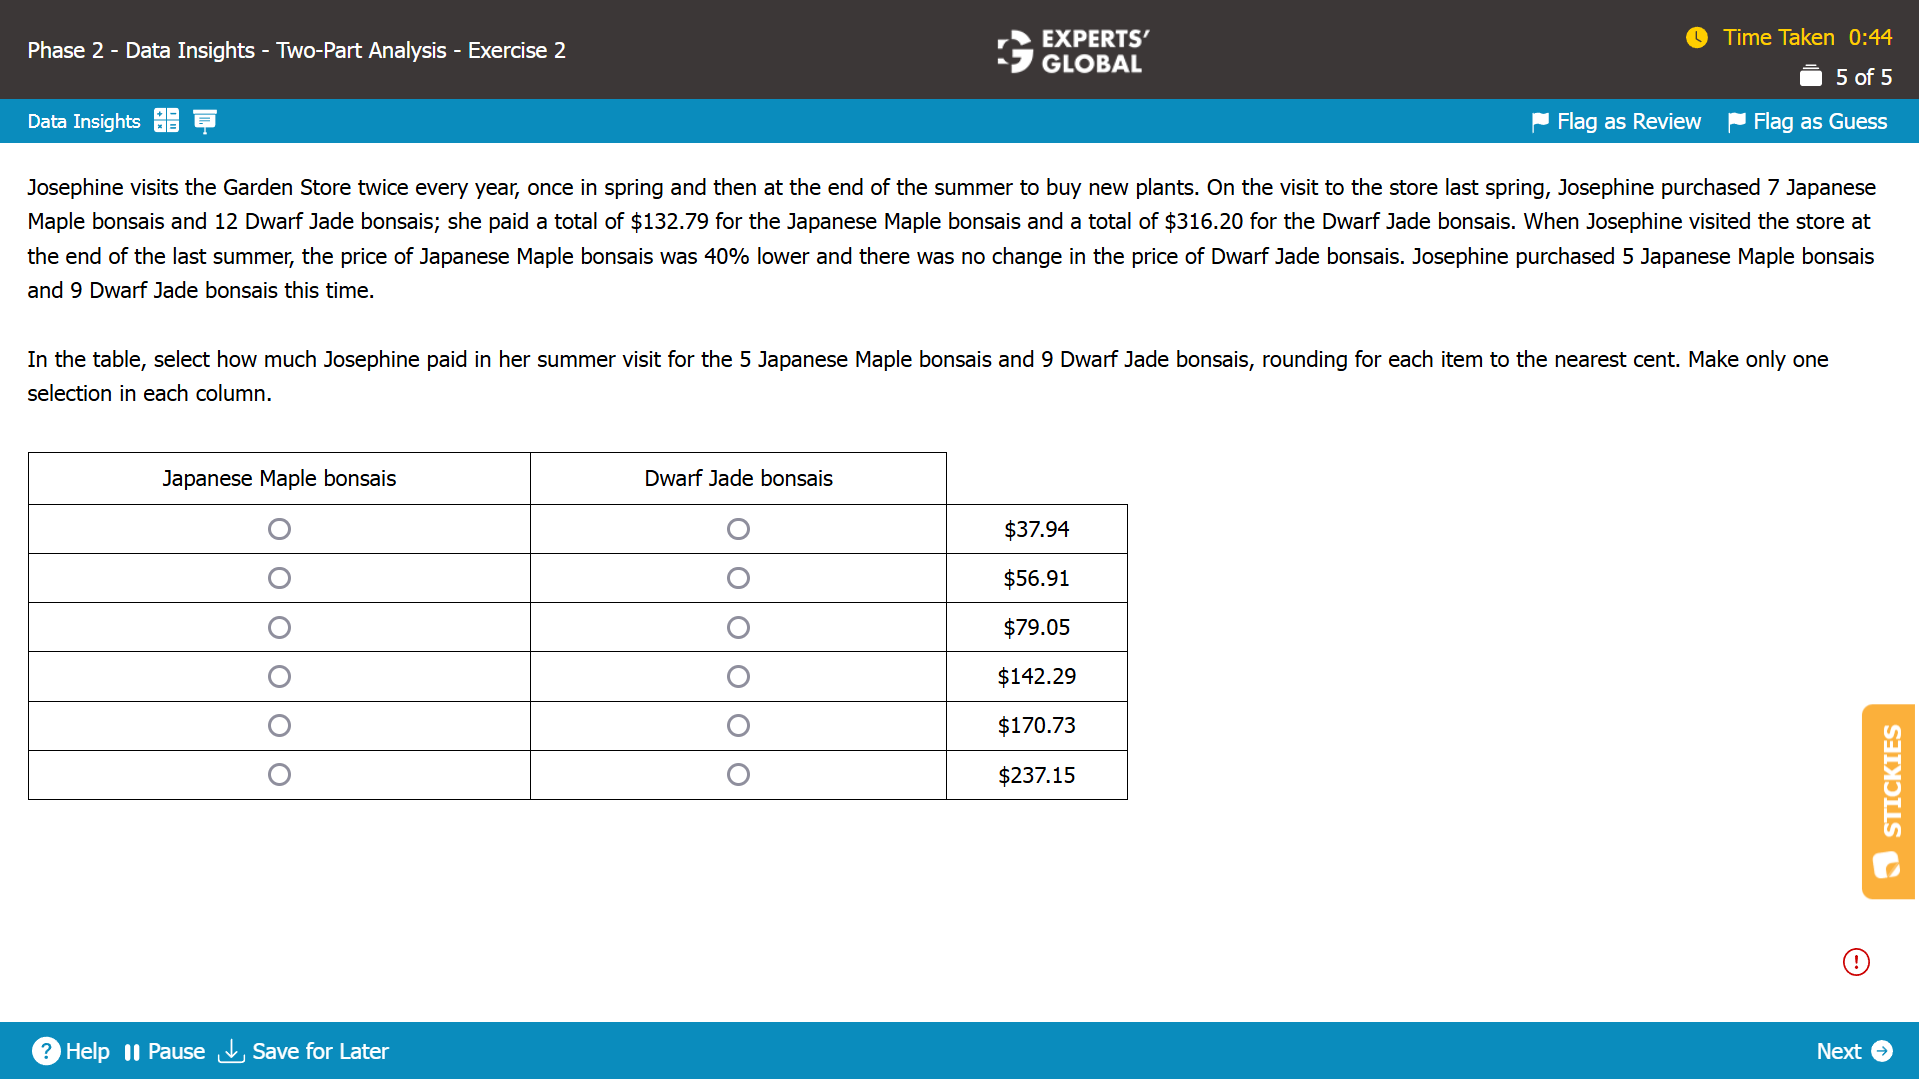
Let the cost of a Japanese Maple bonsai be J.
Let the cost of a Dwarf Jade bonsai be D.
During Spring:
Since Josephine paid a total of $132.79 for 7 Japanese Maple bonsais: 7J = 132.79, which implies J = 132.79 / 7
Since Josephine paid a total of $316.20 for 12 Dwarf Jade bonsais: 12D = 316.20, which implies D = 316.20 / 12
During Summer:
Cost for 5 Japanese Maple bonsais = 0.6 × 5 × 132.79 / 7 = $56.91
Cost for 12 Dwarf Jade bonsais = 9 × 316.20 / 12 = $237.15
Hence, for “Japanese Maple bonsais” column, “$56.91”, and for “Dwarf Jade bonsais” column, “$237.15” is the correct combination of the answer choices.
Graphics Interpretation (GI) Sample Questions
Graphics Interpretation, often referred to as GI, is one of the most distinctive and engaging question types on the GMAT. Instead of asking you to interpret information in a table, a GI question asks you to read information shown visually and judge which responses are supported by what the graphic presents. The GMAT uses this question format to measure how calmly and logically you interpret visual data, rather than how quickly you react to what you see. Out of the 20 questions in the Data Insights section of the GMAT, 3 to 4 are GI. As you work through the sample GI questions below, do not worry about speed at this stage. Instead, use this opportunity to gain first hand familiarity with the graphics interpretation format, flow, user interface, and the layers of logic that shape each question. Keep your focus on engaging carefully with the questions and the reasoning required to arrive at correct answers.
Important: Before visiting the Graphics Interpretation sample questions, if you would like a quick brush up of key GI concepts, you may first visit: Free GMAT Graphics Interpretation Prep
GI Sample Question 1
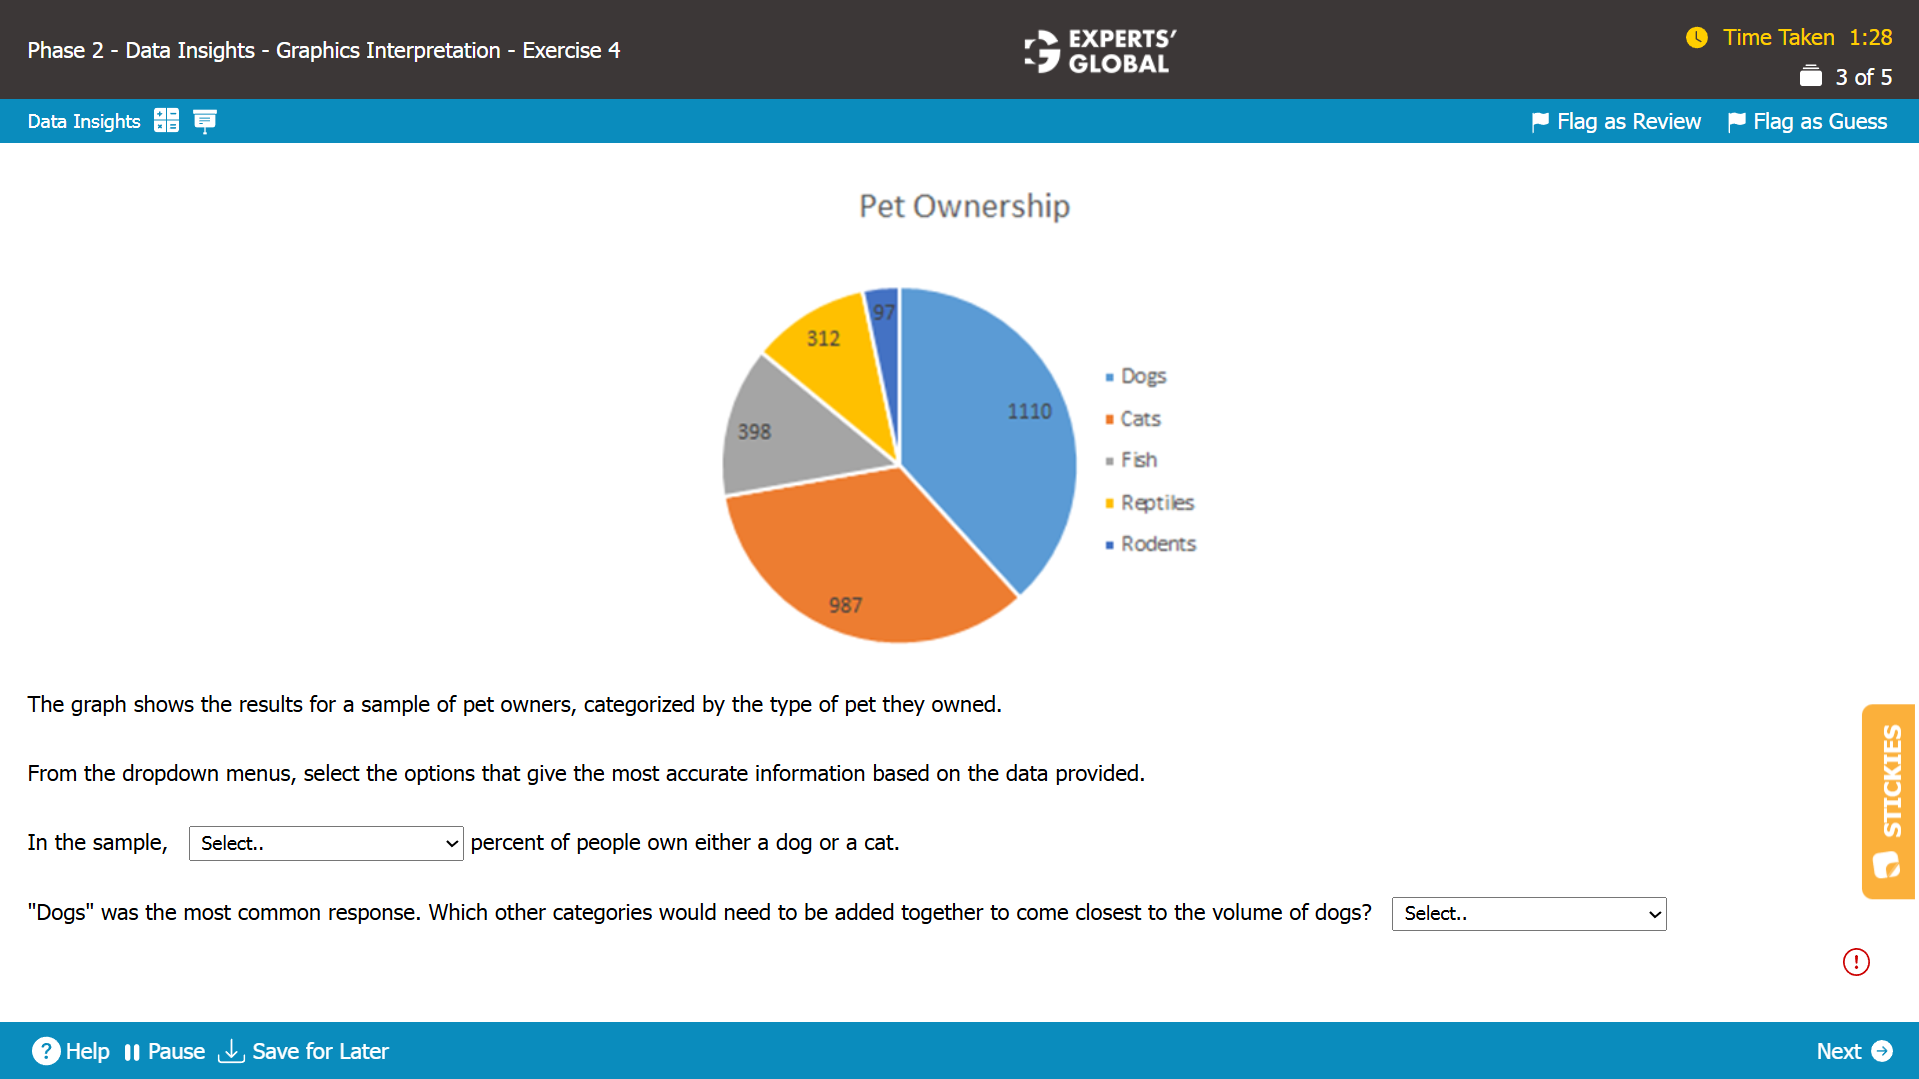
I.
The number of pet owners with dogs or cats is 1110+987 = 2097.
Total pet ownership = 1110+987+398+312+97 = 2904.
So, 2097/2904 = approximately 72% people own either a dog or a cat.
Hence,72is the correct answer choice.
II.
Cats would be needed to reach the number of dogs. By starting with the number of dogs (1,110) and then subtracting the number of cats (987), we get 123. It quickly becomes apparent that rodents (97) would come closest. This can be confirmed by evaluating other answer choices as well.
Hence, Cats & Rodents is the correct answer choice.
Need a comprehensive strategy, approach, and practice for Data Insights questions? Please
click here (you need to be enrolled for a course that includes the DI section).
GI Sample Question 2
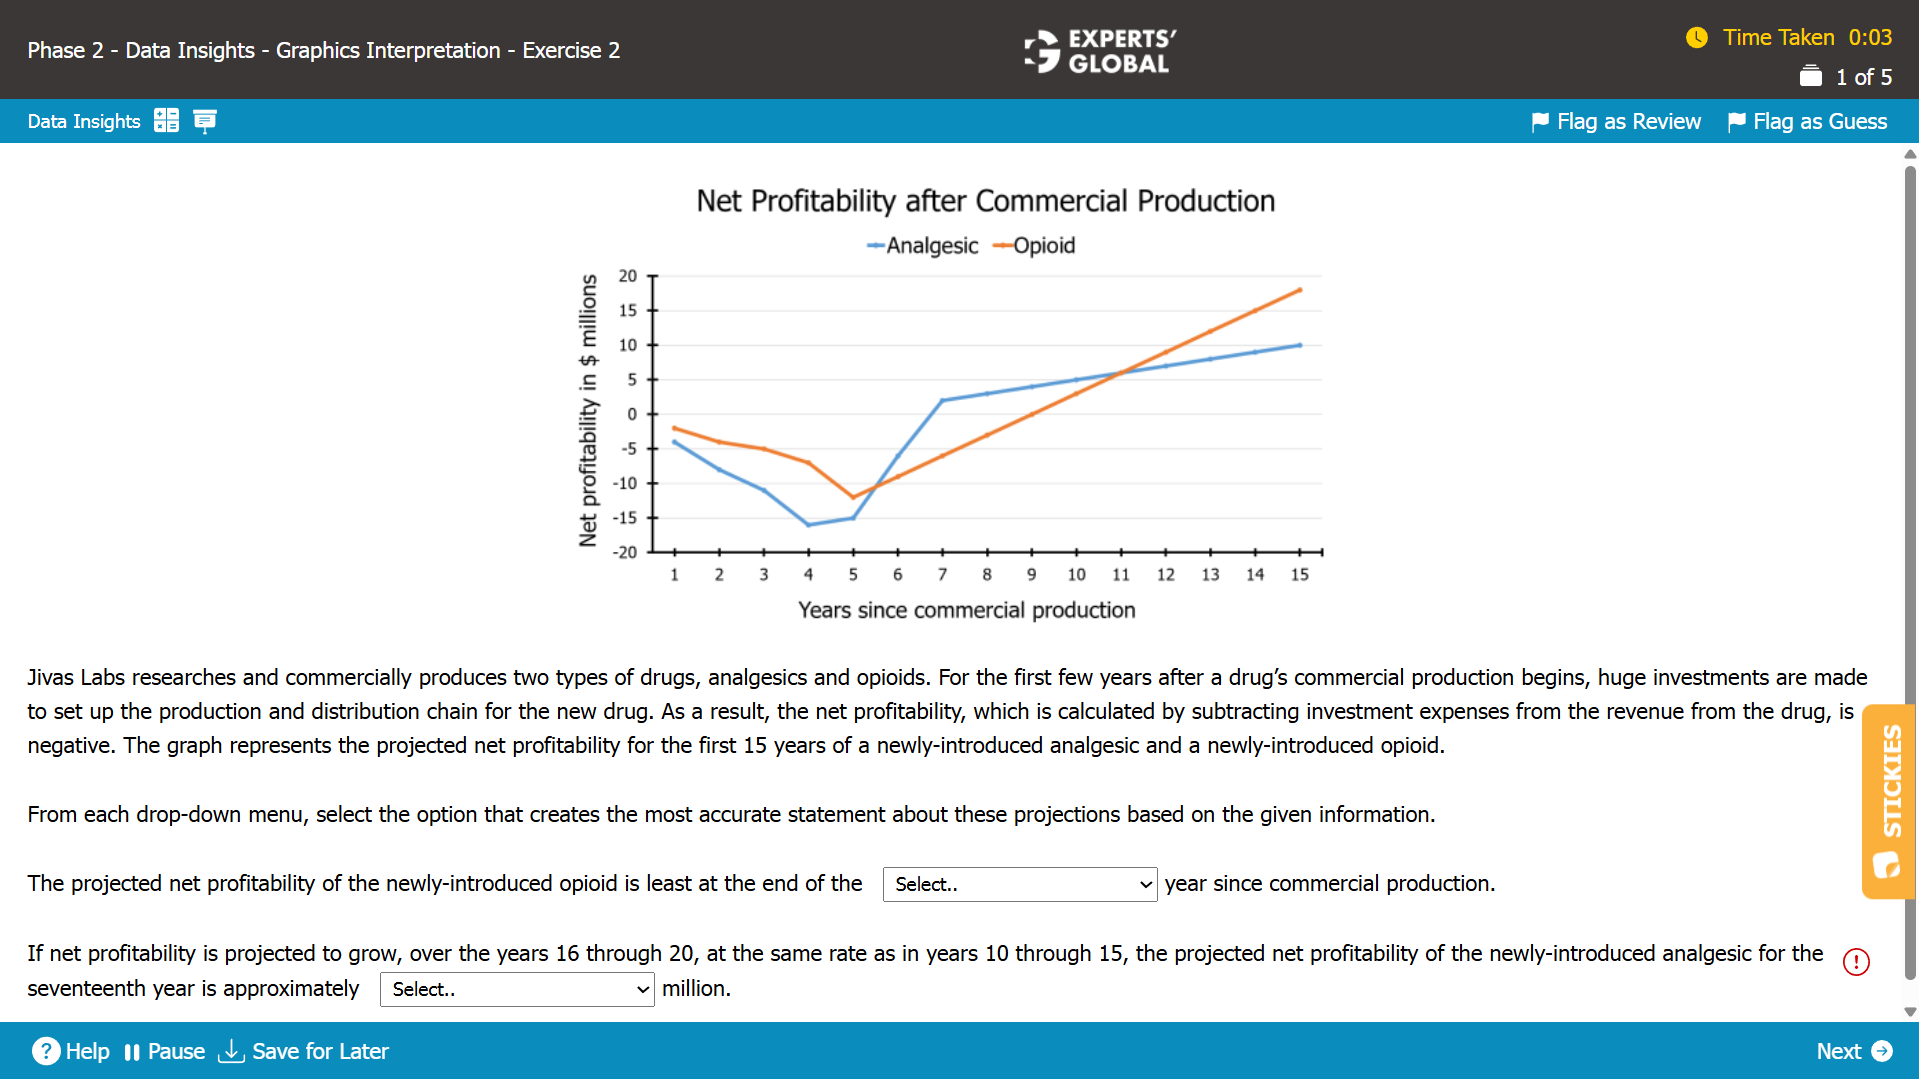
I.
The horizontal axis represents the years since the commercial production began.
The vertical axis represents the projected net profitability.
From the graph, we see that the plotted lines for opioid attain the lowest net profitability value at 5 years since commercial production began.
Hence, fifth is the correct answer choice.
II.
From the graph, we see that the net profitability for the tenth year was $5 million.
From the graph, we see that the net profitability for the fifteenth year was $10 million.
This implies that each year from 10 through 15, the net profitability increased by $1 million.
If the net profitability is projected to grow, over the years 16 through 20, at the same rate as in years 10 through 15, then:
Net profitability for the seventeenth year = Net profitability for the fifteenth year + 2 = 10 + 2 = $12 million.
Hence, $12 is the correct answer choice.
Multi-Source Reasoning (MSR) Sample Questions
Multi-Source Reasoning questions place you in front of information spread across two or three tabs, such as short passages, charts, tables, or statements, and ask you to combine these pieces to answer carefully framed questions. You switch between sources, compare details, and form clear conclusions from the information taken together. Most questions require multiple responses, and an attempt is marked correct only when every selected response is correct, with no partial credit. On the GMAT, you usually see one or two Multi-Source Reasoning sets, with three questions in each set, meaning either three or six of the twenty Data Insights questions follow this format. Below is a complete set of three sample Multi-Source Reasoning questions that give you first hand exposure to how concepts are tested through the MSR question type. As you work through them, without worrying about speed, focus on understanding the format, how information is presented, the nature and texture of the questions, the user interface, and the reasoning approach needed for correct responses.
Important: Before visiting the Multi-Source Reasoning sample questions, if you would like a quick brush up of key MSR concepts, you may first visit: Free GMAT Multi-Source Reasoning Prep
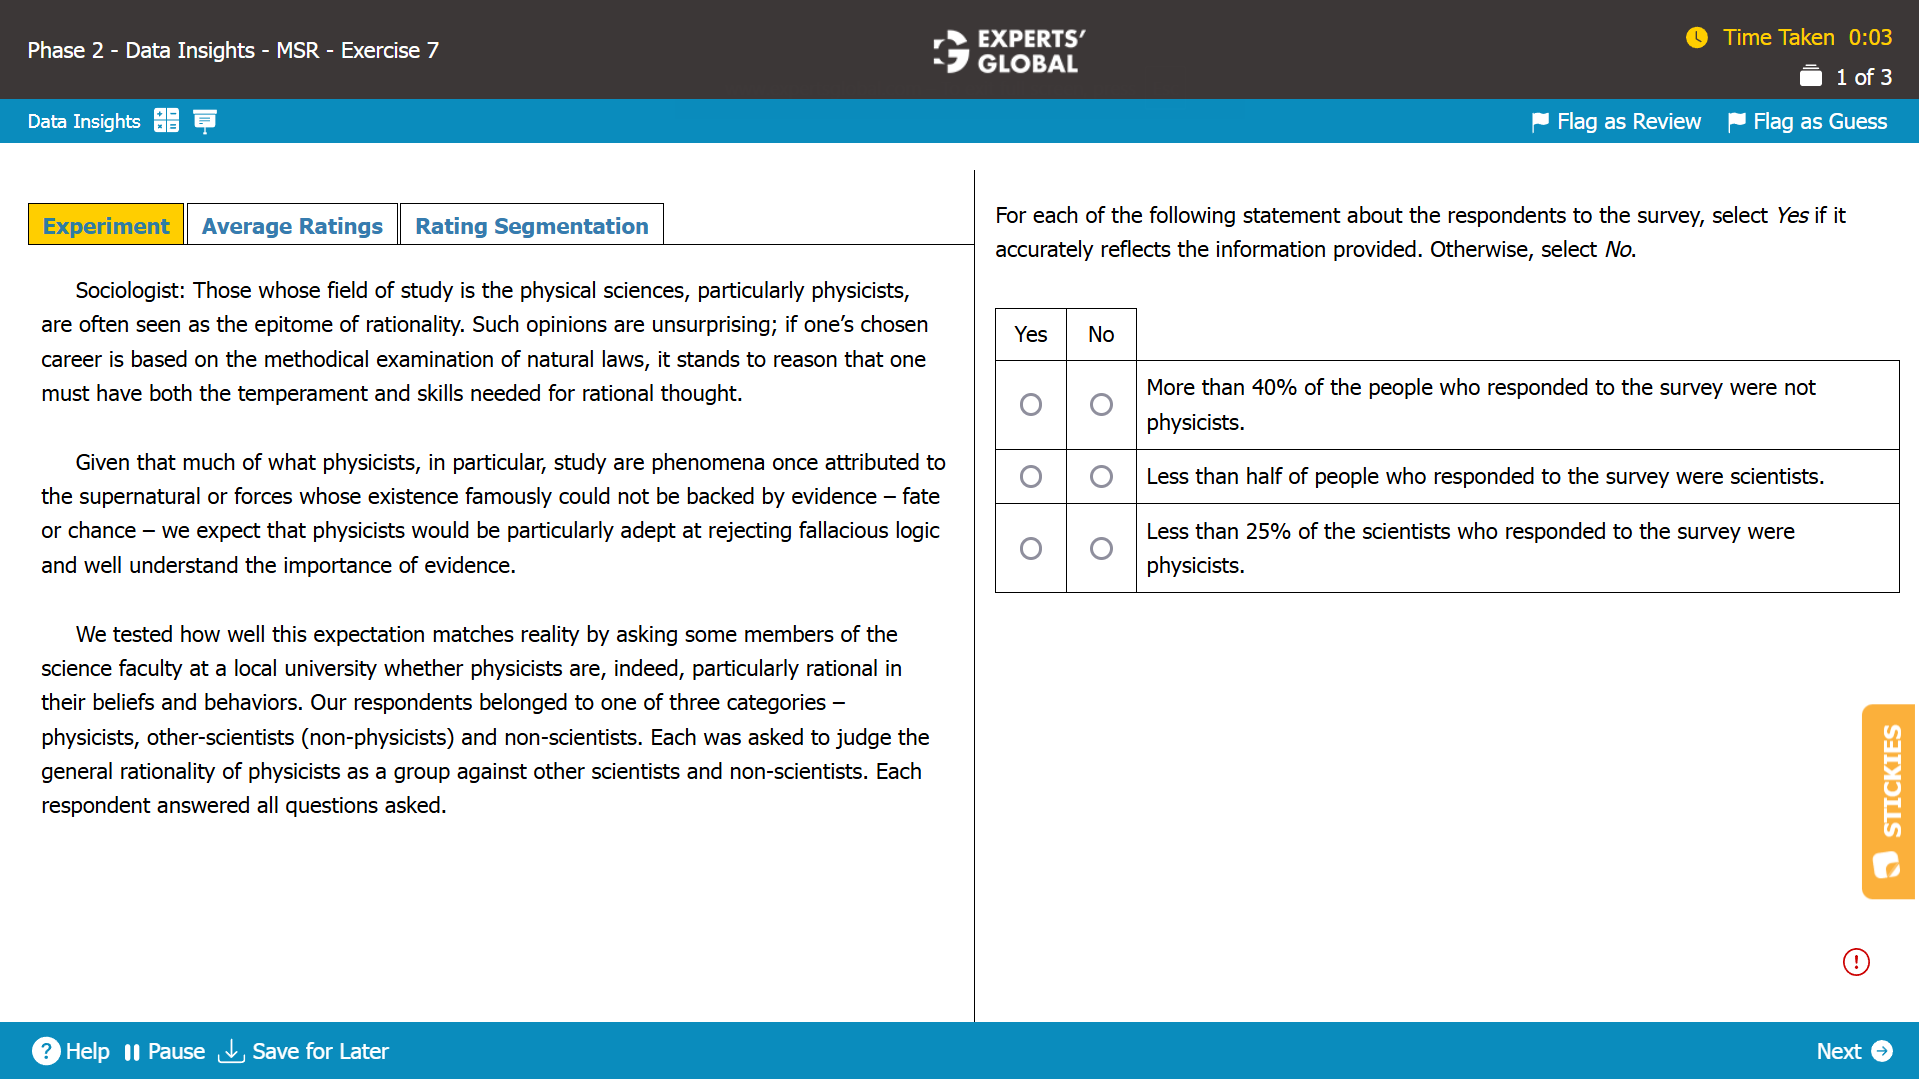
Tab 1 + Question 1
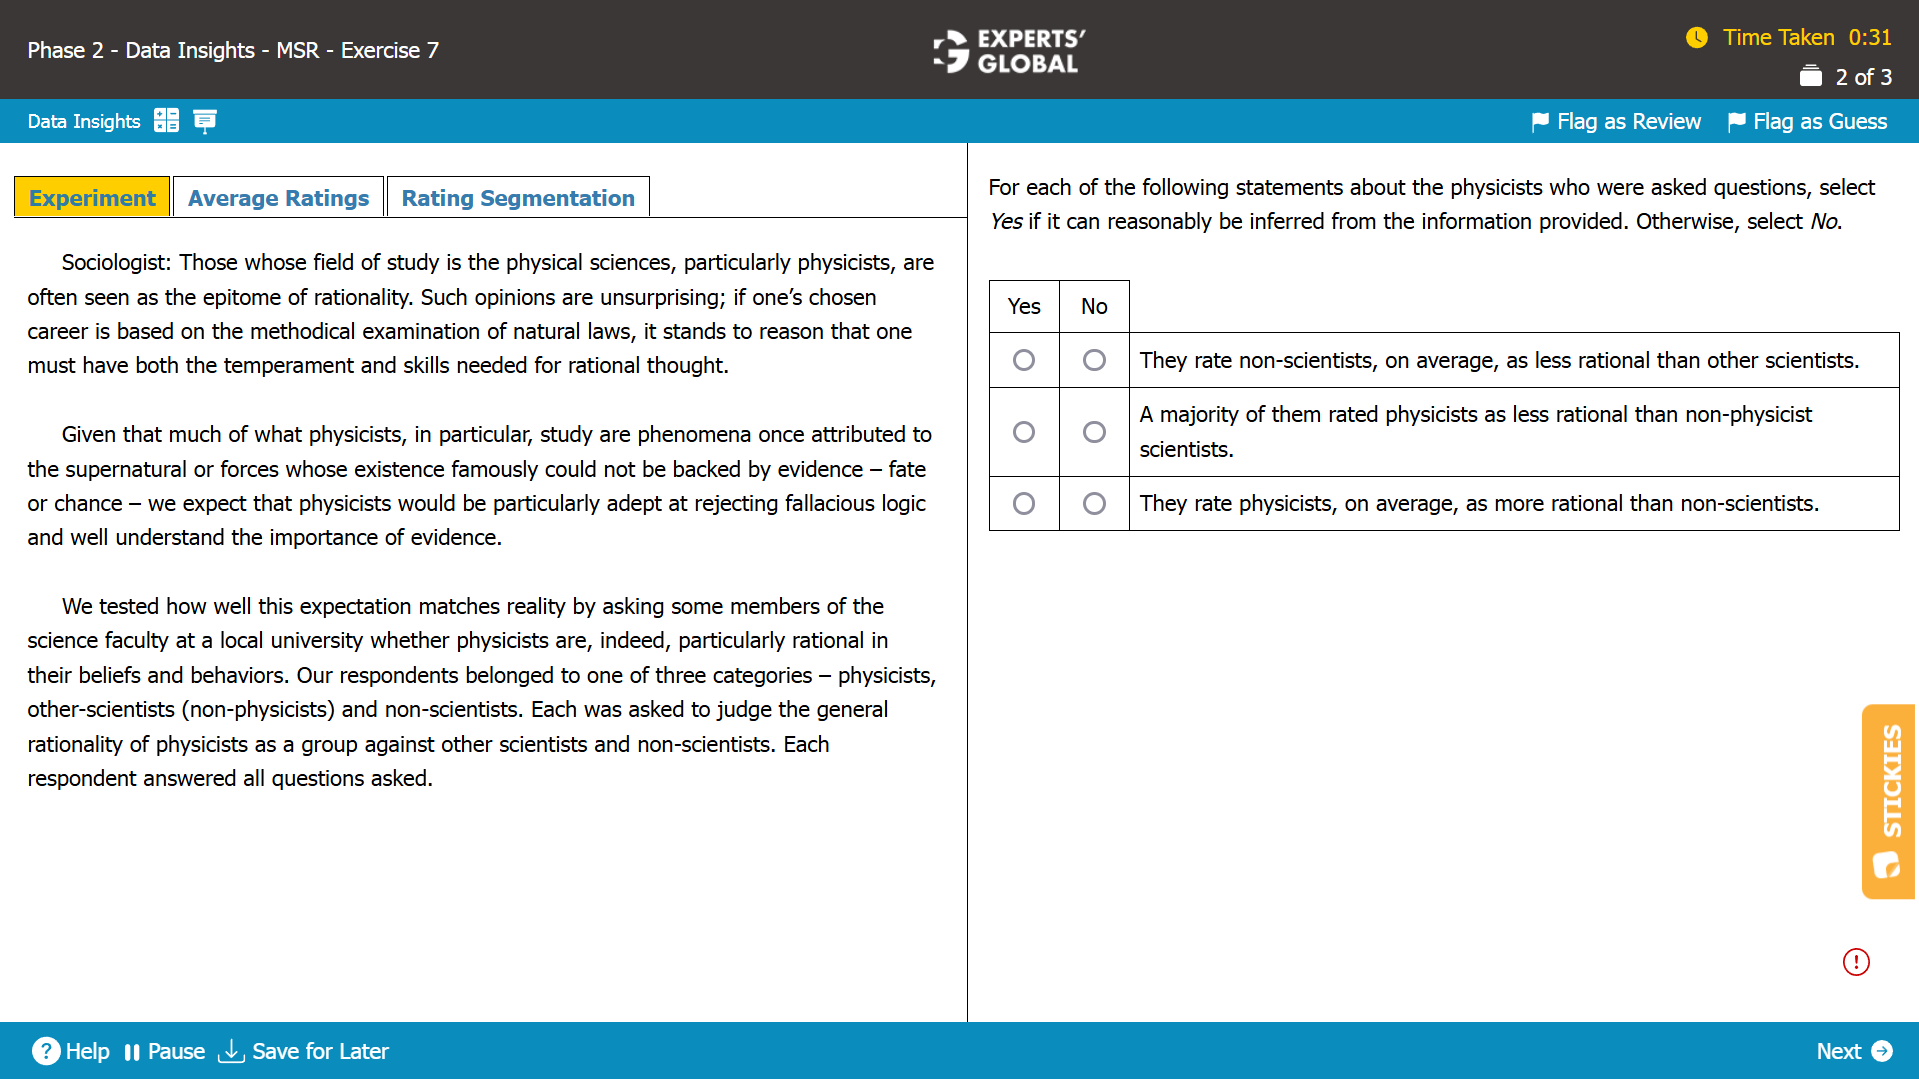
Tab 2 + Question 2
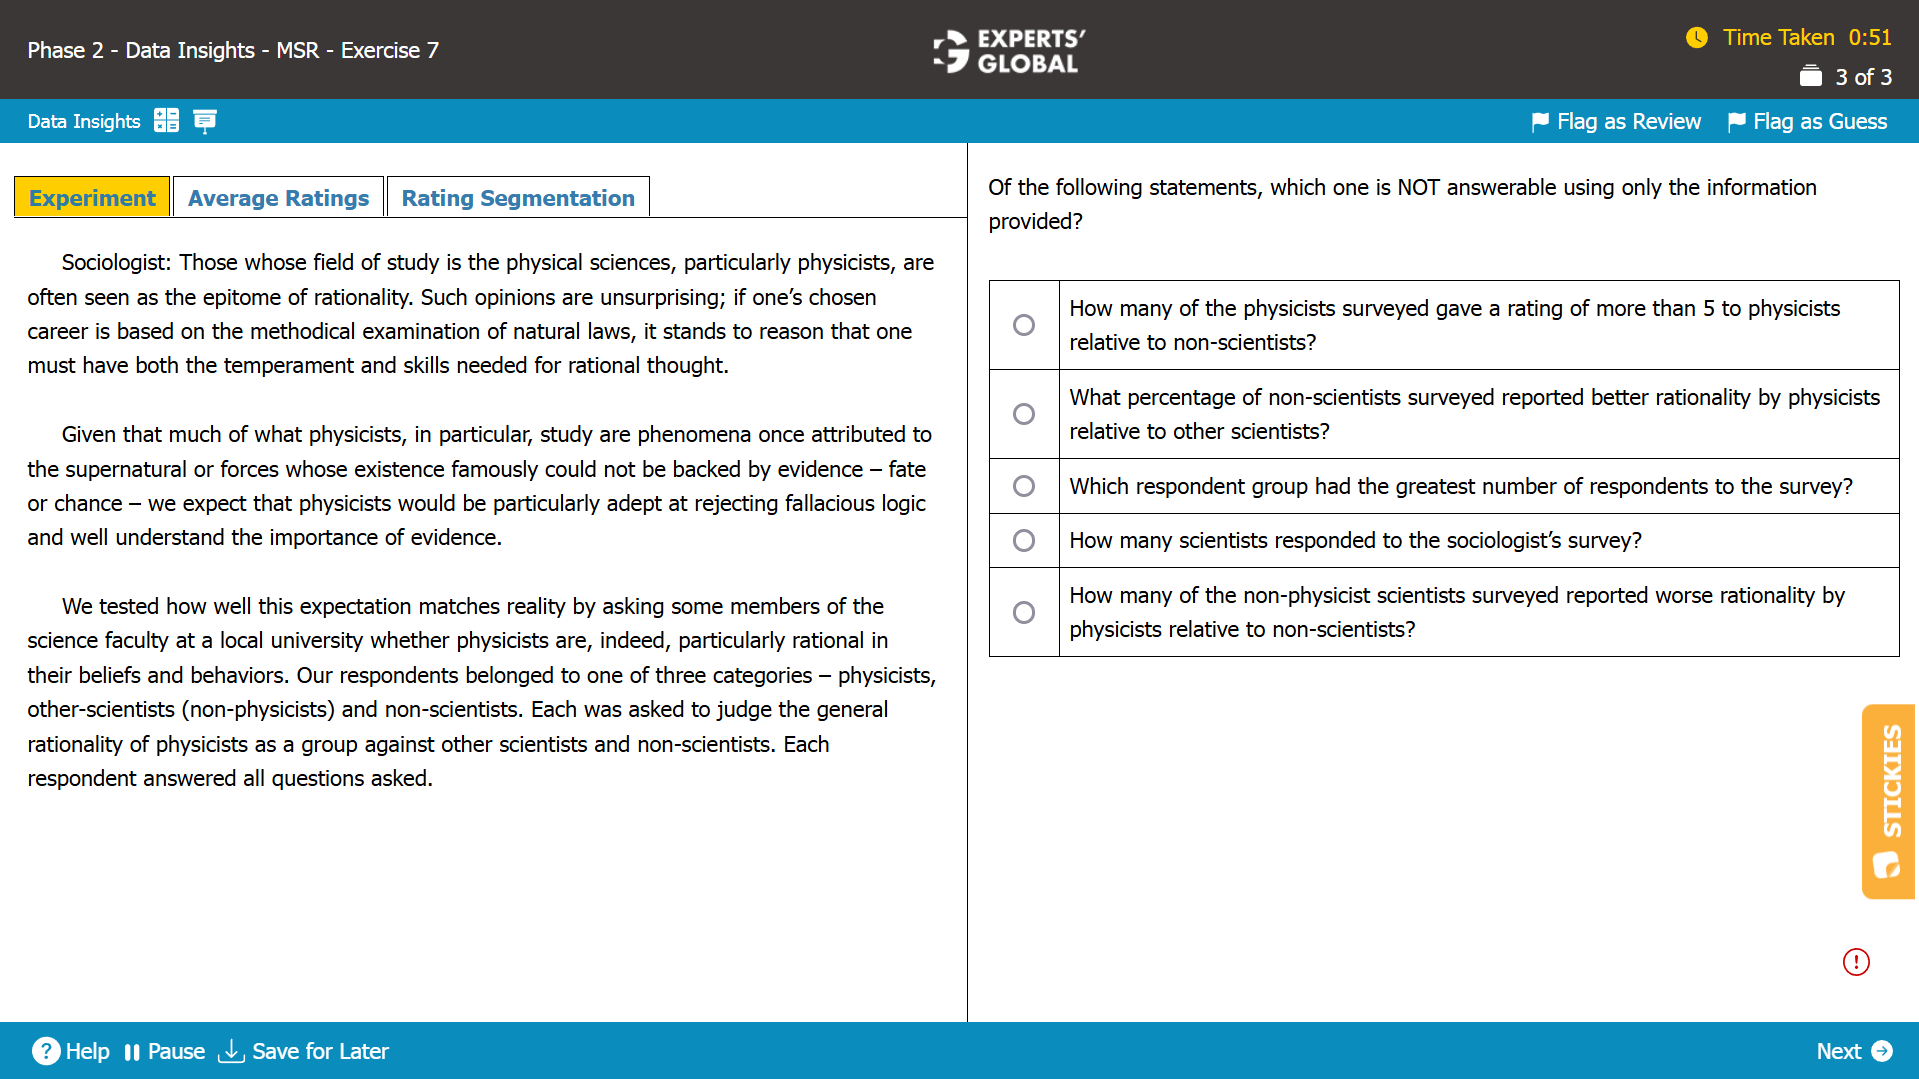
Tab 3 + Question 3
Show correct answer to Question 1
From the table in the “Average Ratings” tab, we see that 24 physicists, 31 other scientists, and 15 non-scientists responded to the survey.
I.Total number of people who responded to the survey = 24 + 31 + 15 = 70. Total number of people who responded to the survey but were not physicists = 31 + 15 = 46.Required percentage = 46/70 = 66% > 40%.Thus, “Yes” is the correct answer choice.
II. Total number of people who responded to the survey = 24 + 31 + 15 = 70. Total number of people who responded to the survey and were scientists = 24 + 31 = 55. Required percentage = 55/70 = 79% > 50%. Thus, “No” is the correct answer choice.
III. Total number of people who responded to the survey and were scientists = 24 + 31 = 55. Total number of physicists who responded to the survey = 24. Required percentage = 24/55 = 44% > 25%. Thus, “No” is the correct answer choice.
Hence, Yes-No-No is the correct combination of answer choices.
Show correct answer to Question 2
I.The survey only compares the rationality of physicists as a group against other scientists and non-scientists.Since no information is provided regarding physicists rating the rationality of non-scientists as compared to other scientists, this statement cannot be inferred. Thus, “No” is the correct answer choice.
II.From the table in the “Average Ratings” tab, we see that 24 physicists responded to the survey.From the table in the “Rating Segmentation” tab, we see that only 4 physicists rated physicists as less rational than other scientists.Since 4/24 < 50%, we cannot infer that a majority of them rated physicists as less rational than other scientists.Thus, “No” is the correct answer choice.
III. From the table in the “Average Ratings” tab, we see that on average, physicists rated their rationality 6.7 as compared to non-scientists.From the “Average Ratings” tab, we know that a rating above 5 indicates that physicists are more rational than the comparison group.Therefore, it can be inferred that they rate physicists, on average, as more rational than non-scientists. Thus, “Yes” is the correct answer choice.
Hence, No-No-Yes is the correct combination of answer choices.
Show correct answer to Question 3
A.From the table in the “Rating Segmentation” tab, we see that 14 physicists surveyed gave a rating of more than 5 to physicists relative to non-scientists.Thus, this answer choice is incorrect.
B.The “Rating Segmentation” tab only provides the distribution of responses by physicists and other scientists.No information is provided to determine the number of non-scientists who reported better rationality by physicists relative to other scientists.Thus, this answer choice is correct.
C.From the table in the “Average Ratings” tab, we see that the respondent group with the greatest number of respondents to the survey is the “other scientists” category, with 31 respondents.Thus, this answer choice is incorrect.
D.From the table in the “Average Ratings” tab, we see 24 physicists and 31 other scientists responded to the survey.Therefore, the total number of scientists who responded to the sociologist’s survey = 24 + 31 = 55.Thus, “No” is the correct answer choice.
E.From the table in the “Rating Segmentation” tab, we see that 6 non-physicist scientists surveyed reported worse rationality by physicists relative to non-scientists.Thus, this answer choice is incorrect.
Hence, B is the correct answer choice.
Additional Free GMAT-style Multi-Source Reasoning (MSR) Questions with Explanations:
Please find another set of GMAT-style MSR questions with explanations on: How to Solve GMAT Multi-Source Reasoning Questions
Please find 2 sets of GMAT-style MSR questions with explanations on: Free GMAT Multi-Source Reasoning Prep
Please find another set of GMAT-style MSR questions with explanations on: Free GMAT Data Insights Prep
Please find 2 sets of GMAT-style MSR questions with explanations on: Free GMAT Multi-Source Reasoning Sample Questions
Please find another set of GMAT-style MSR questions with explanations on: Free GMAT Sample Questions
For Further Prep and Practice:
15 full-length GMAT practice tests (includes a free test)
End-to-end GMAT prep course online (includes 7-day free trial)
GMAT 5-weeks crash course
GMAT Prep + Admission Consulting Bundle