The GRE features one data interpretation set in quantitative reasoning, comprising three questions based on a common data source, typically one or two charts. Data interpretation accounts for about 10% of the overall measure and roughly 25% of the first quantitative section; this makes DI particularly important because performance in the first Quant section determines the difficulty of the second section and affects the overall GRE score. On this page, we present you two GRE-style practice question sets with detailed explanation. Spend focused hours with this resource and carry these learnings into your further GRE prep and practice across GRE quizzes, GRE sectional tests and GRE full-length tests. Wishing you productive practice!
Important: If you need to undergo thorough Data Interpretation preparation, please visit Free GRE Data Interpretation prep
GRE Data Interpretation Practice Set 1
Practice Question 1 | Data Interpretation
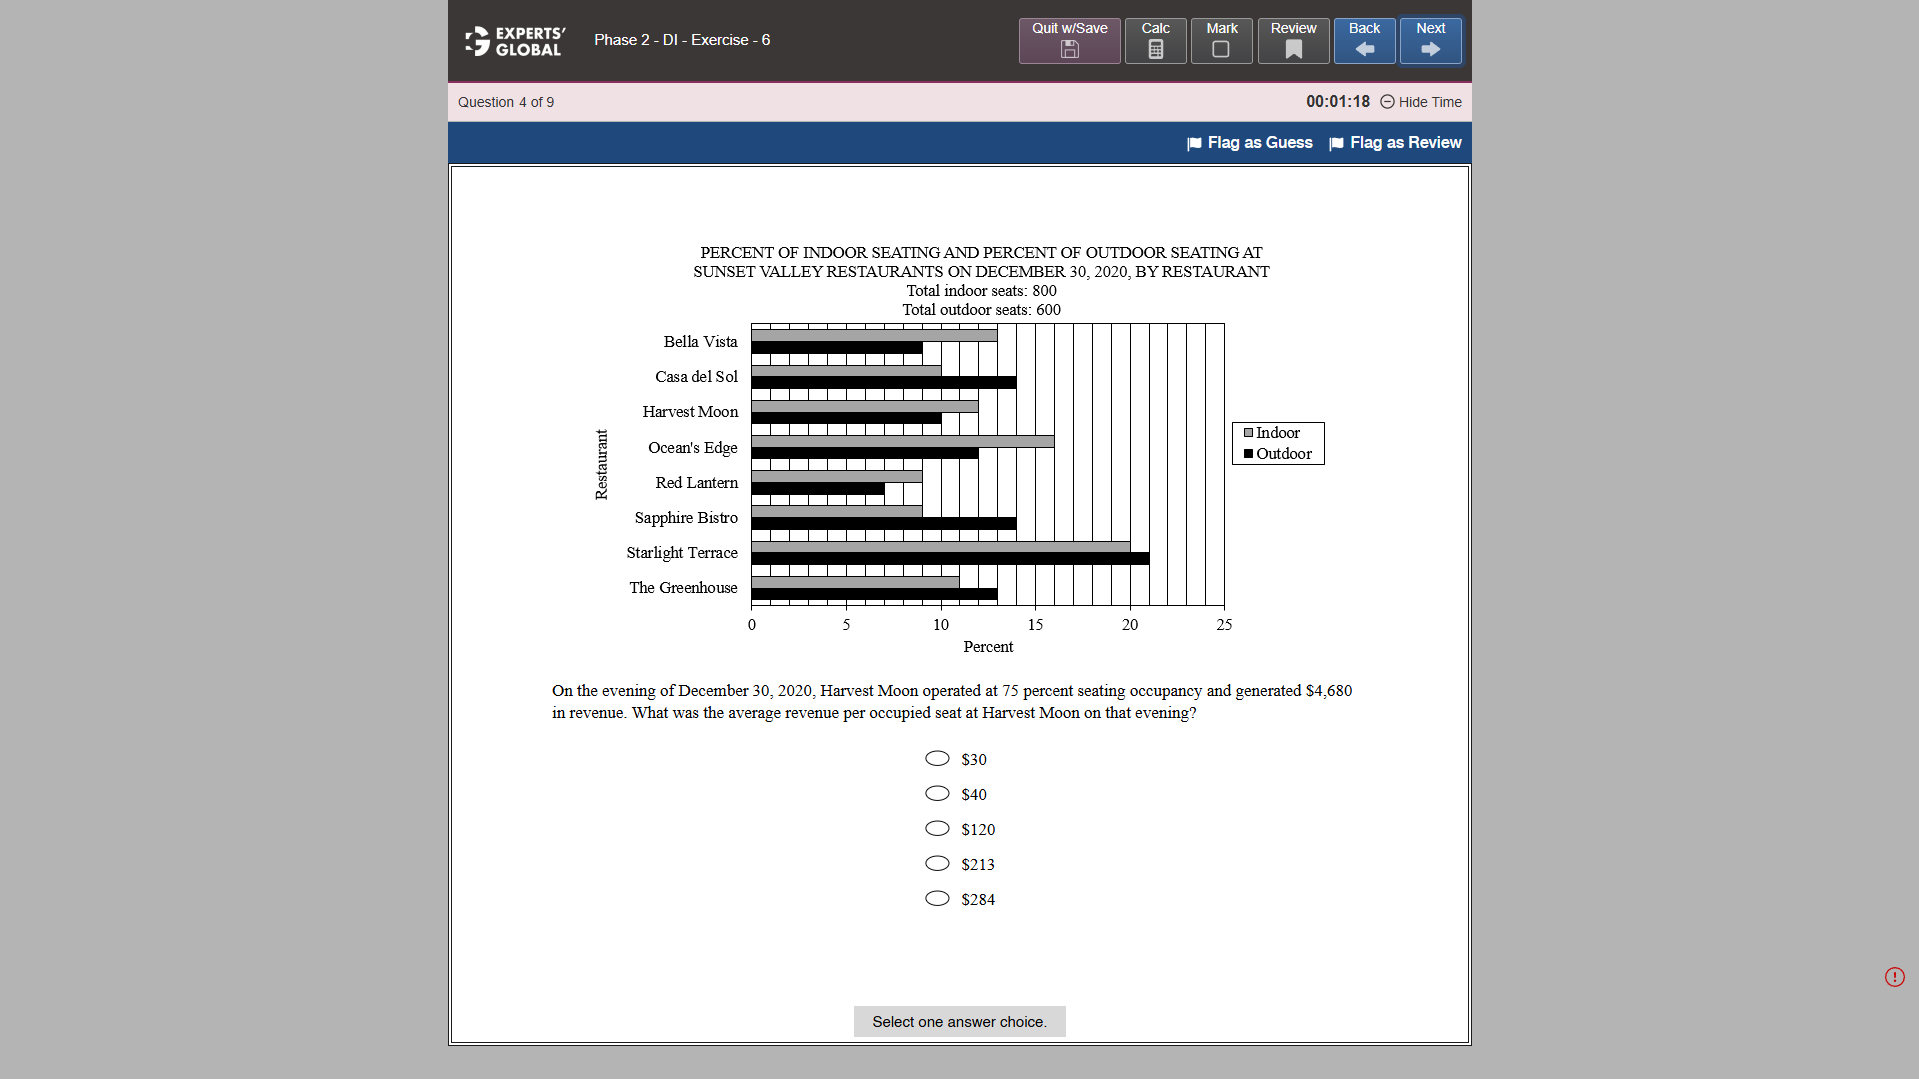
On the evening of December 30, 2020, Harvest Moon operated at 75 percent seating occupancy and generated $4,680 in revenue. What was the average revenue per occupied seat at Harvest Moon on that evening?
A. $30
B. $40
C. $120
D. $213
E. $284
Written Explanation
Total number of indoor seats = 800.
Percentage of indoor seats at Harvest Moon = 12%.
Thus, the number of indoor seats at Harvest Moon = 0.12 × 800 = 96.
Total number of outdoor seats = 600.
Percentage of outdoor seats at Harvest Moon = 10%.
Thus, the number of outdoor seats at Harvest Moon = 0.1 × 600 = 60.
The total number of seats at Harvest Moon
= (The number of indoor seats at Harvest Moon) + (The number of outdoor seats at Harvest Moon)
= 96 + 60
= 156
On the evening of December 30, 2020, Harvest Moon operated at 75 percent seating occupancy and generated $4,680 in revenue.
The total number of occupied seats on the evening of December 30, 2020
= 75% of the total number of seats at Harvest Moon
= 0.75 × 156
= 117
The average revenue per occupied seat at Harvest Moon on the evening of December 30, 2020
= (Revenue) / (The total number of occupied seats)
= ($4,680) / 117
= $40
B is the correct answer choice.
Practice Question 2 | Data Interpretation

Ocean’s Edge plans to increase its indoor and outdoor seating capacities each by 25 percent. What is the total number of additional seats that will be required?
A. 7
B. 35
C. 40
D. 50
E. 250
Written Explanation
Total number of indoor seats = 800.
Percentage of indoor seats at Ocean’s Edge = 16%.
Thus, the number of indoor seats at Ocean’s Edge = 0.16 × 800 = 128.
Total number of outdoor seats = 600.
Percentage of outdoor seats at Ocean’s Edge = 12%.
Thus, the number of outdoor seats at Ocean’s Edge = 0.12 × 600 = 72.
The total number of seats at Ocean’s Edge
= (The number of indoor seats at Ocean’s Edge) + (The number of outdoor seats at Ocean’s Edge)
= 128 + 72
= 200
Ocean’s Edge plans to increase its indoor and outdoor seating capacities each by 25 percent.
The total number of additional seats that will be required
= 25% of the total number of seats at Ocean’s Edge
= 0.25 × 200
= 50
D is the correct answer choice.
Practice Question 3 | Data Interpretation
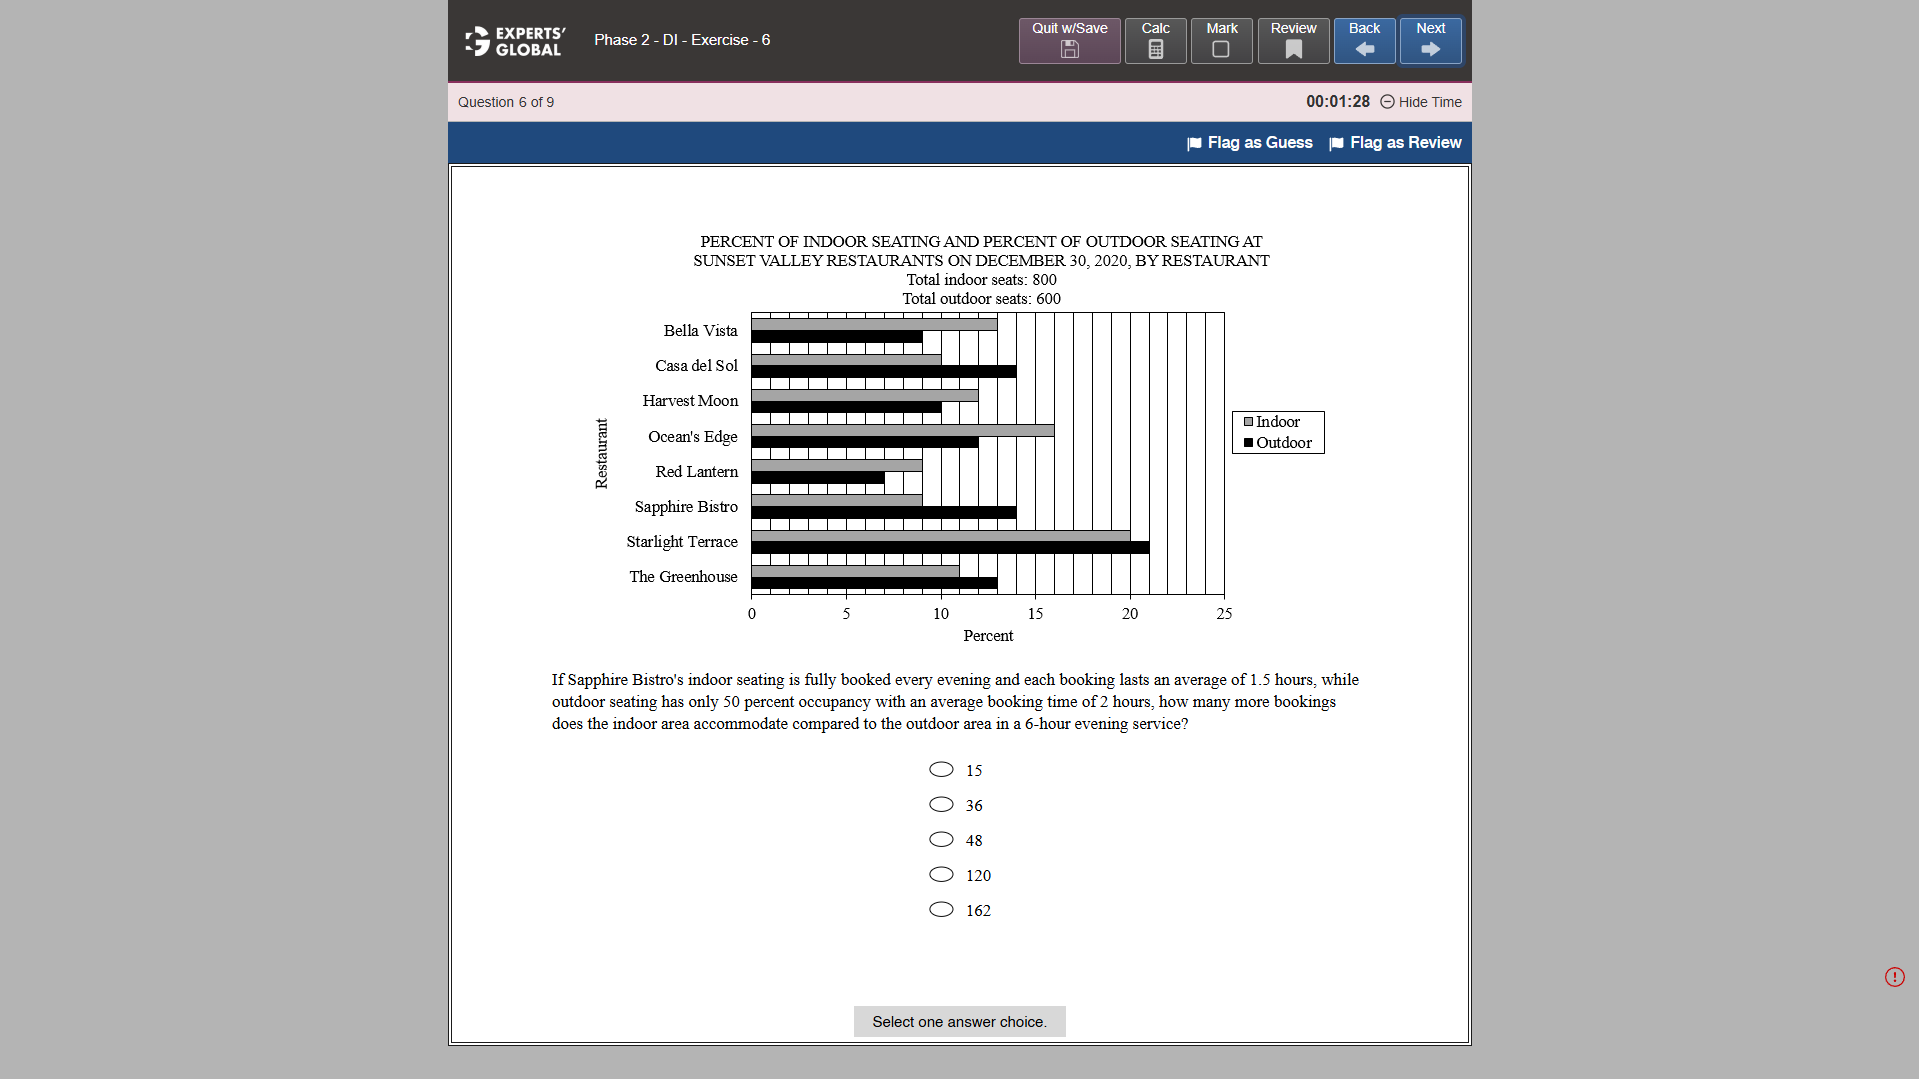
If Sapphire Bistro’s indoor seating is fully booked every evening and each booking lasts an average of 1.5 hours, while outdoor seating has only 50 percent occupancy with an average booking time of 2 hours, how many more bookings does the indoor area accommodate compared to the outdoor area in a 6-hour evening service?
A. 15
B. 36
C. 48
D. 120
E. 162
Written Explanation
Total number of indoor seats = 800.
Percentage of indoor seats at Sapphire Bistro = 9%.
Thus, the number of indoor seats at Sapphire Bistro = 0.09 × 800 = 72.
Sapphire Bistro’s indoor seating is fully booked every evening.
Thus, the number of occupied indoor seats at Sapphire Bistro = 72.
Each indoor booking lasts an average of 1.5 hours.
Thus, in a 6-hour evening service, the number of bookings per indoor seat = 6 / 1.5 = 4.
The total number of indoor bookings
= (Number of occupied indoor seats) × (Number of bookings per indoor seat)
= 72 × 4
= 288
Total number of outdoor seats = 600.
Percentage of outdoor seats at Sapphire Bistro = 14%.
Thus, the number of outdoor seats at Sapphire Bistro = 0.14 × 600 = 84.
Sapphire Bistro’s outdoor seating has only 50 percent occupancy.
Thus, the number of occupied outdoor seats at Sapphire Bistro = 50% of 84 = 42.
Each outdoor booking lasts an average of 2 hours.
Thus, in a 6-hour evening service, the number of bookings per outdoor seat = 6 / 2 = 3.
The total number of outdoor bookings
= (Number of occupied outdoor seats) × (Number of bookings per outdoor seat)
= 42 × 3
= 126
The difference between the total number of indoor bookings and outdoor bookings = 288 – 126 = 162.
Hence, the indoor area accommodates 162 more bookings than the outdoor area in a 6-hour evening service.
E is the correct answer choice.
GRE Data Interpretation Practice Set 2
Practice Question 4 | Data Interpretation
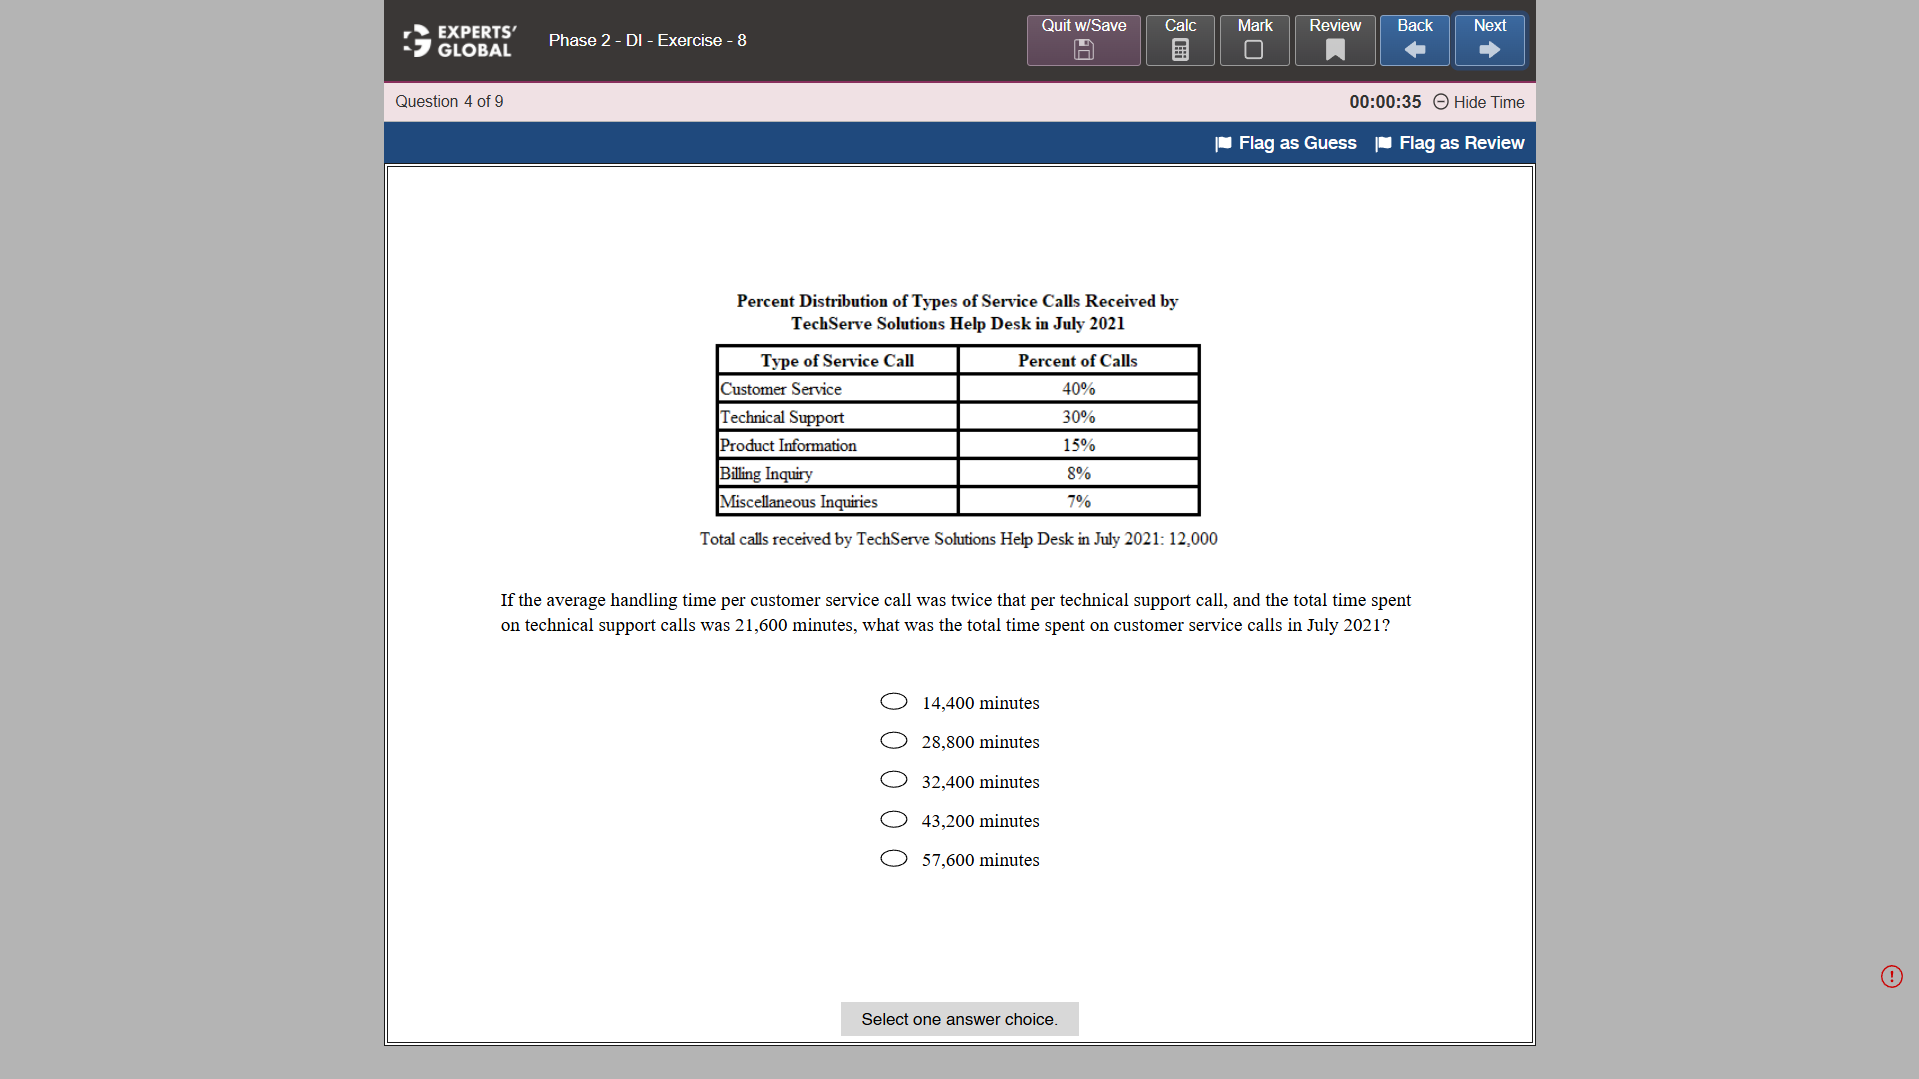
If the average handling time per customer service call was twice that per technical support call, and the total time spent on technical support calls was 21,600 minutes, what was the total time spent on customer service calls in July 2021?
A. 14,400 minutes
B. 28,800 minutes
C. 32,400 minutes
D. 43,200 minutes
E. 57,600 minutes
Written Explanation
The average handling time per customer service call = 2 × (The average handling time per technical support call)
The total time spent on technical support calls = 21,600 minutes.
We need to determine the total time spent on customer service calls.
The total number of technical support calls received
= (Percent of technical support calls) × (Total service calls received)
= (30%) × (12,000)
= 3,600
The average handling time per technical support call
= (Total time spent on technical support calls) / (Total number of technical support calls received)
= (21,600 minutes) / 3,600
= 6 minutes
The average handling time per customer service call
= 2 × (The average handling time per technical support call)
= 2 × 6 minutes
= 12 minutes
The total number of customer service calls received
= (Percent of customer service calls) × (Total service calls received)
= (40%) × (12,000)
= 4,800
The total time spent on customer service calls
= (Average handling time for customer service calls) × (Total number of customer service calls received)
= (12 minutes) × 4,800
= 57,600 minutes
Hence, the total time spent on customer service calls was 57,600 minutes.
E is the correct answer choice.
Practice Question 5 | Data Interpretation
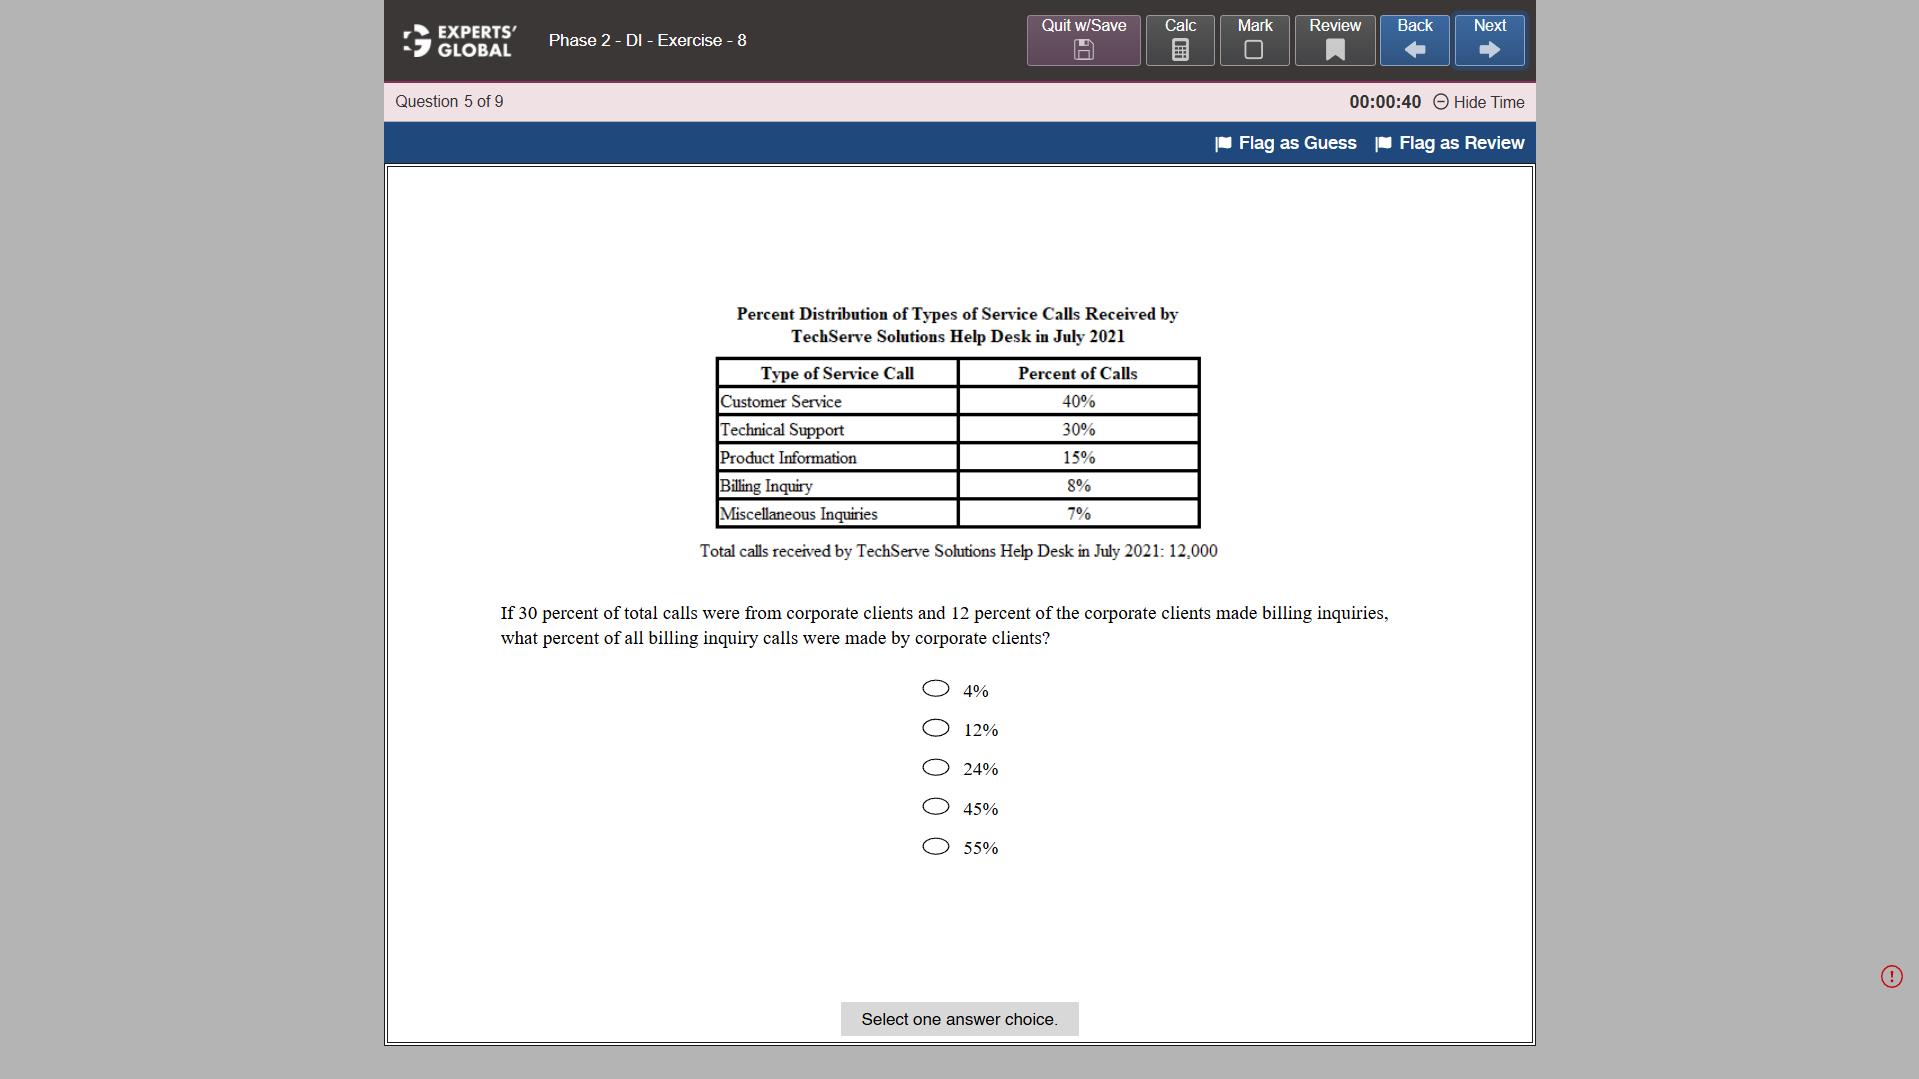
If 30 percent of total calls were from corporate clients and 12 percent of the corporate clients made billing inquiries, what percent of all billing inquiry calls were made by corporate clients?
A. 4%
B. 12%
C. 24%
D. 45%
E. 55%
Written Explanation
From the table, we see that the total number of calls received = 12,000.
Additionally, the table shows that 8% of calls were billing inquiry calls.
Thus, the total number of billing inquiry calls = 0.08 × 12,000.
30 percent of the calls were from corporate clients.
Thus, the total number of calls from corporate clients = 0.3 × 12,000.
12 percent of the corporate clients made billing inquiries.
Thus, the total number of billing inquiry calls from corporate clients = 0.12 × 0.3 × 12,000.
Required percentage
= (Total number of billing inquiry calls from corporate) / (Total number of billing inquiry calls)
= (0.12 × 0.3 × 12,000) / (0.08 × 12,000)
= 0.45 = 45%
D is the correct answer choice.
Practice Question 6 | Data Interpretation
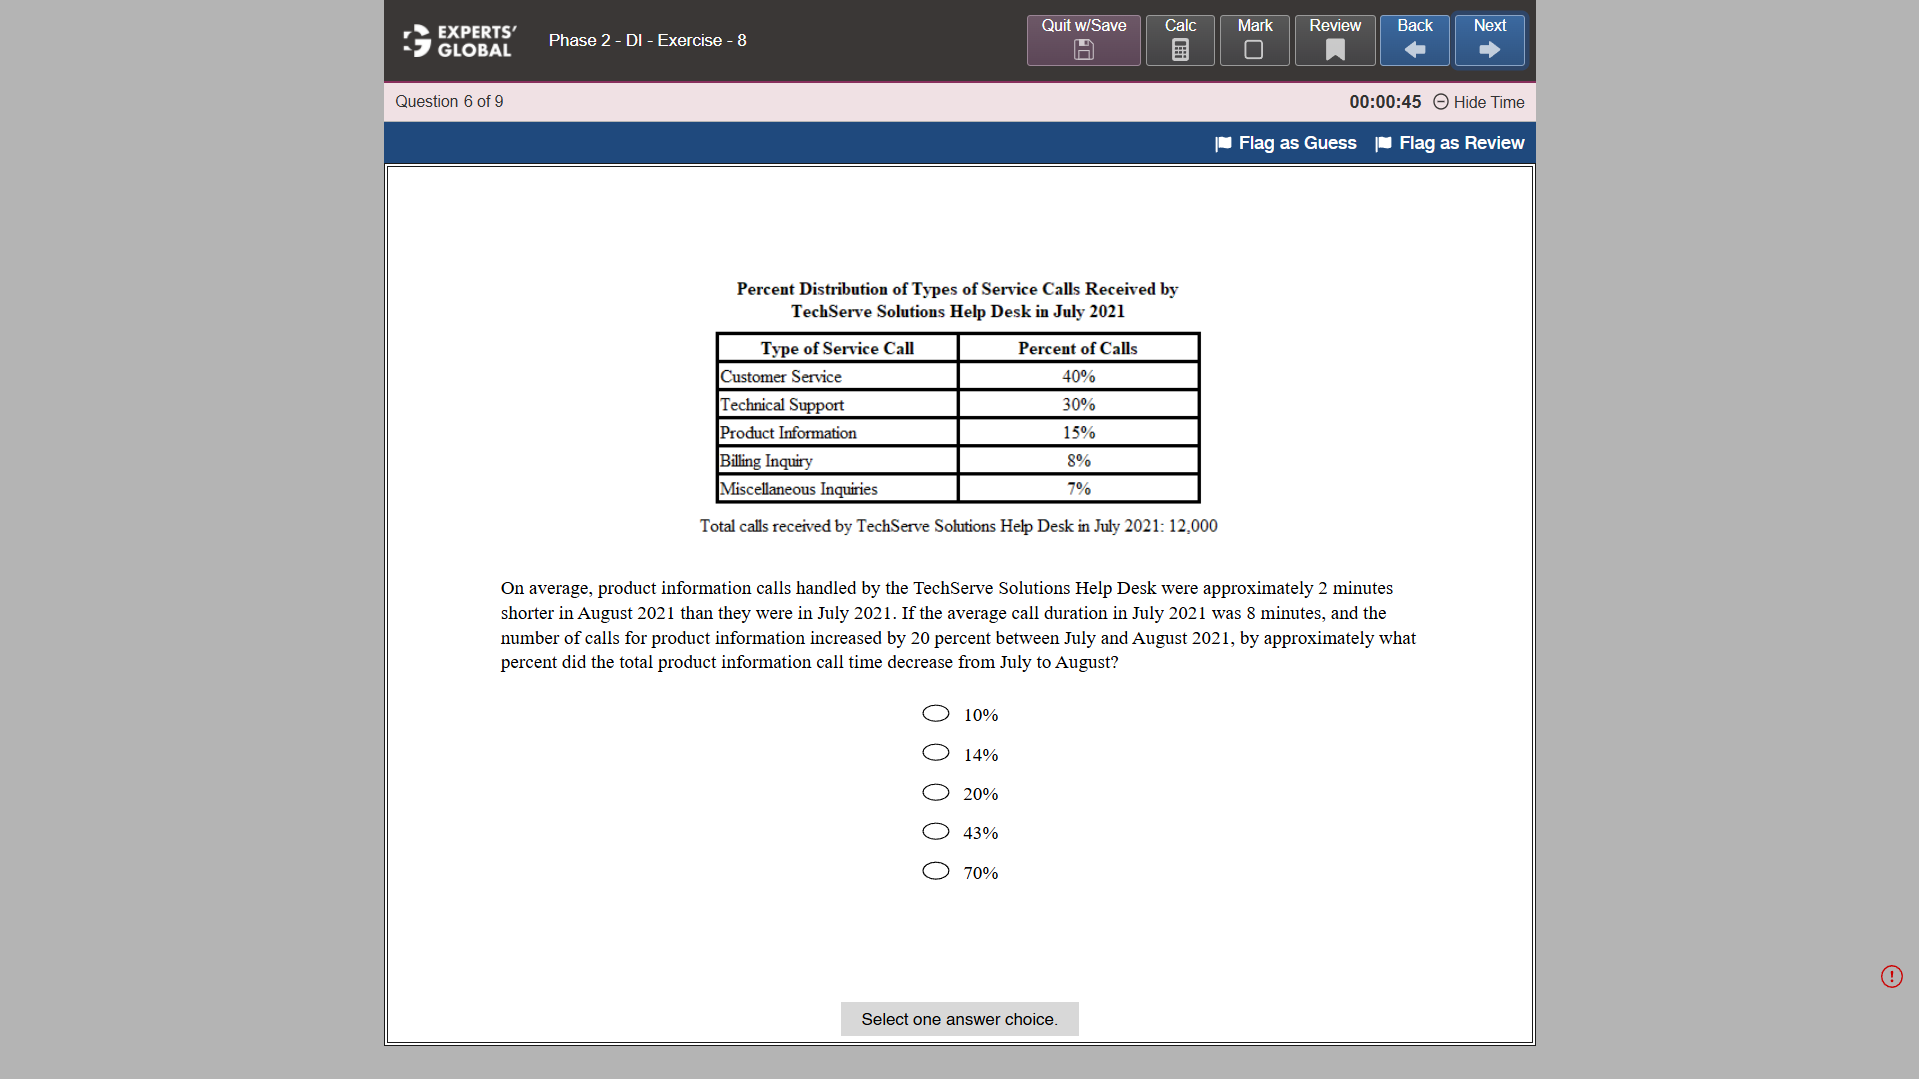
On average, product information calls handled by the TechServe Solutions Help Desk were approximately 2 minutes shorter in August 2021 than they were in July 2021. If the average call duration in July 2021 was 8 minutes, and the number of calls for product information increased by 20 percent between July and August 2021, by approximately what percent did the total product information call time decrease from July to August?
A. 10%
B. 14%
C. 20%
D. 43%
E. 70%
Written Explanation
From the table, we see that the total number of calls received in July 2021 = 12,000.
Additionally, the table shows that 15% of calls were product information calls.
Thus, the total number of product information calls received in July 2021 = 0.15 × 12,000 = 1,800.
The average call duration in July 2021 was 8 minutes.
Thus, the total call time for product information in July 2021 = (8 minutes) × 1,800 = 14,400 minutes.
The number of calls for product information increased by 20 percent between July and August 2021.
Thus, the total number of product information calls in August 2021 = 1.2 × 1,800 = 2,160.
On average, product information calls handled by the TechServe Solutions Help Desk were approximately 2 minutes shorter in August 2021 than they were in July 2021.
Thus, the average duration per call in August 2021 = 8 minutes – 2 minutes = 6 minutes.
The total call time for product information in August 2021 = (6 minutes) × 2,160 = 12,960 minutes.
Required percentage
= [(Total call time for product information in July 2021) – (Total call time for product information in August 2021)] / (Total call time for product information in July 2021)
= (14,400 – 12,960) / 14,400
= 10%
Hence, the total call time for product information decreased by 10 percent compared to July 2021.
A is the correct answer choice.
Resource for Additional GRE-style Data Interpretation Practice Questions
Please find a set of 12 GRE-style DI questions with explanations on: Free GRE Data Interpretation 12 Practice Questions with Solutions
Please find a set of assorted GRE-style questions (all types) with explanations on: Free GRE Practice Questions with Solutions
For Further GRE Prep and Practice…
End-to-end GRE prep course online (includes 7-day free trial)
15 full-length GRE practice tests
60 sectional GRE practice tests
Free full-length GRE diagnostic test
GRE Prep + Admission Consulting Bundle

