
Invest 30 seconds...
...for what may lead to a life altering association!
Help Line
- +91.8800.2828.00 (IND)
- 1030-1830 Hrs IST, Mon-Sat
- support@expertsglobal.com
33% off ends soon:GMAT/GRE prep + applications bundle. Profile building, longer mentoring, better results. Inquire
Below is a set of 10 GRE style Data Interpretation questions designed for thorough practice and exposure to the range of problem types and variations commonly tested in the quantitative section of the GRE. A part of our GRE online preparation course, the following video presents 10 solved GRE style questions based on varied chart types and rich data sources. This set helps you experience breadth and depth across Data Interpretation questions tested on the GRE. Take your time to understand the data, the questions, and the reasoning behind every solution. The focus here is on applying the concepts and approach you learned in the recent Data Interpretation lessons and building accuracy through thoughtful practice on GRE drills, GRE sectional mocks, and GRE full mocks.

Correct Answer: C
For a detailed explanation, please refer to the video presented earlier on this page.
Following is a concise, step-wise written explanation…
In the year 2021, approximately what was the total revenue of Bright Harvest FMCG?
A. $55 million
B. $162 million
C. $284 million
D. $371 million
E. Cannot be determined from the given data
To find the total revenue of the entire company, we use the relationship: (44 / 100) * Total Revenue = 125 million
Total Revenue = (125 * 100) / 44
Total Revenue = 12500 / 44
Total Revenue is approximately 284 million
Final Answer: C
Correct Answer: C
For a detailed explanation, please refer to the video presented earlier on this page.
Following is a concise, step-wise written explanation…
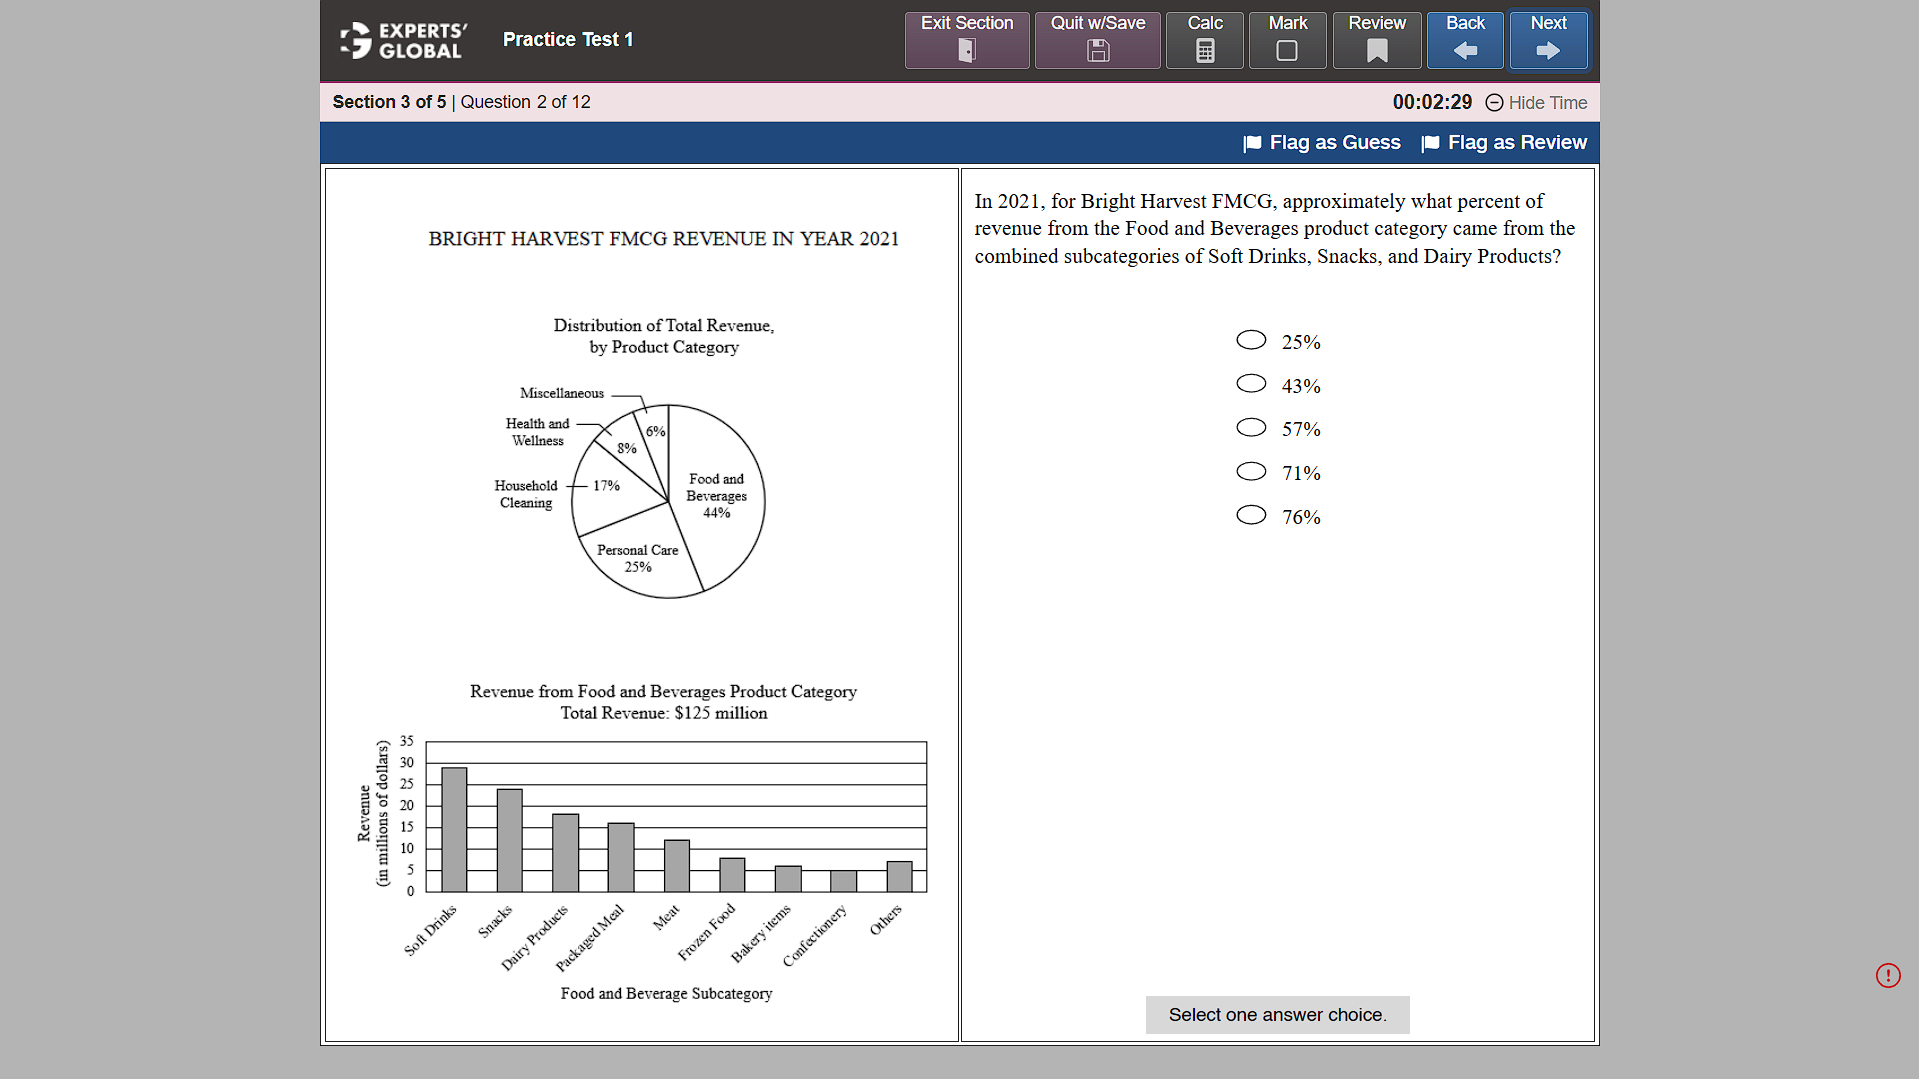
In 2021, for Bright Harvest FMCG, approximately what percent of revenue from the Food and Beverages product category came from the combined subcategories of Soft Drinks, Snacks, and Dairy Products?
A. 25%
B. 43%
C. 57%
D. 71%
E. 76%
Look at the bar chart titled Revenue from Food and Beverages Category. Read the values for the three specific subcategories:
Add these three values together to find the total for the group:
29 + 24 + 18 = 71 million dollars
The bar chart title states that the Total Revenue for the Food and Beverages category is 125 million dollars.
To find the percentage, divide the combined subcategory revenue by the total category revenue and multiply by 100:
(71 / 125) * 100
= 56.8%
The value 56.8% is approximately 57%.
Correct Answer: C
Correct Answer: E
For a detailed explanation, please refer to the video presented earlier on this page.
Following is a concise, step-wise written explanation…
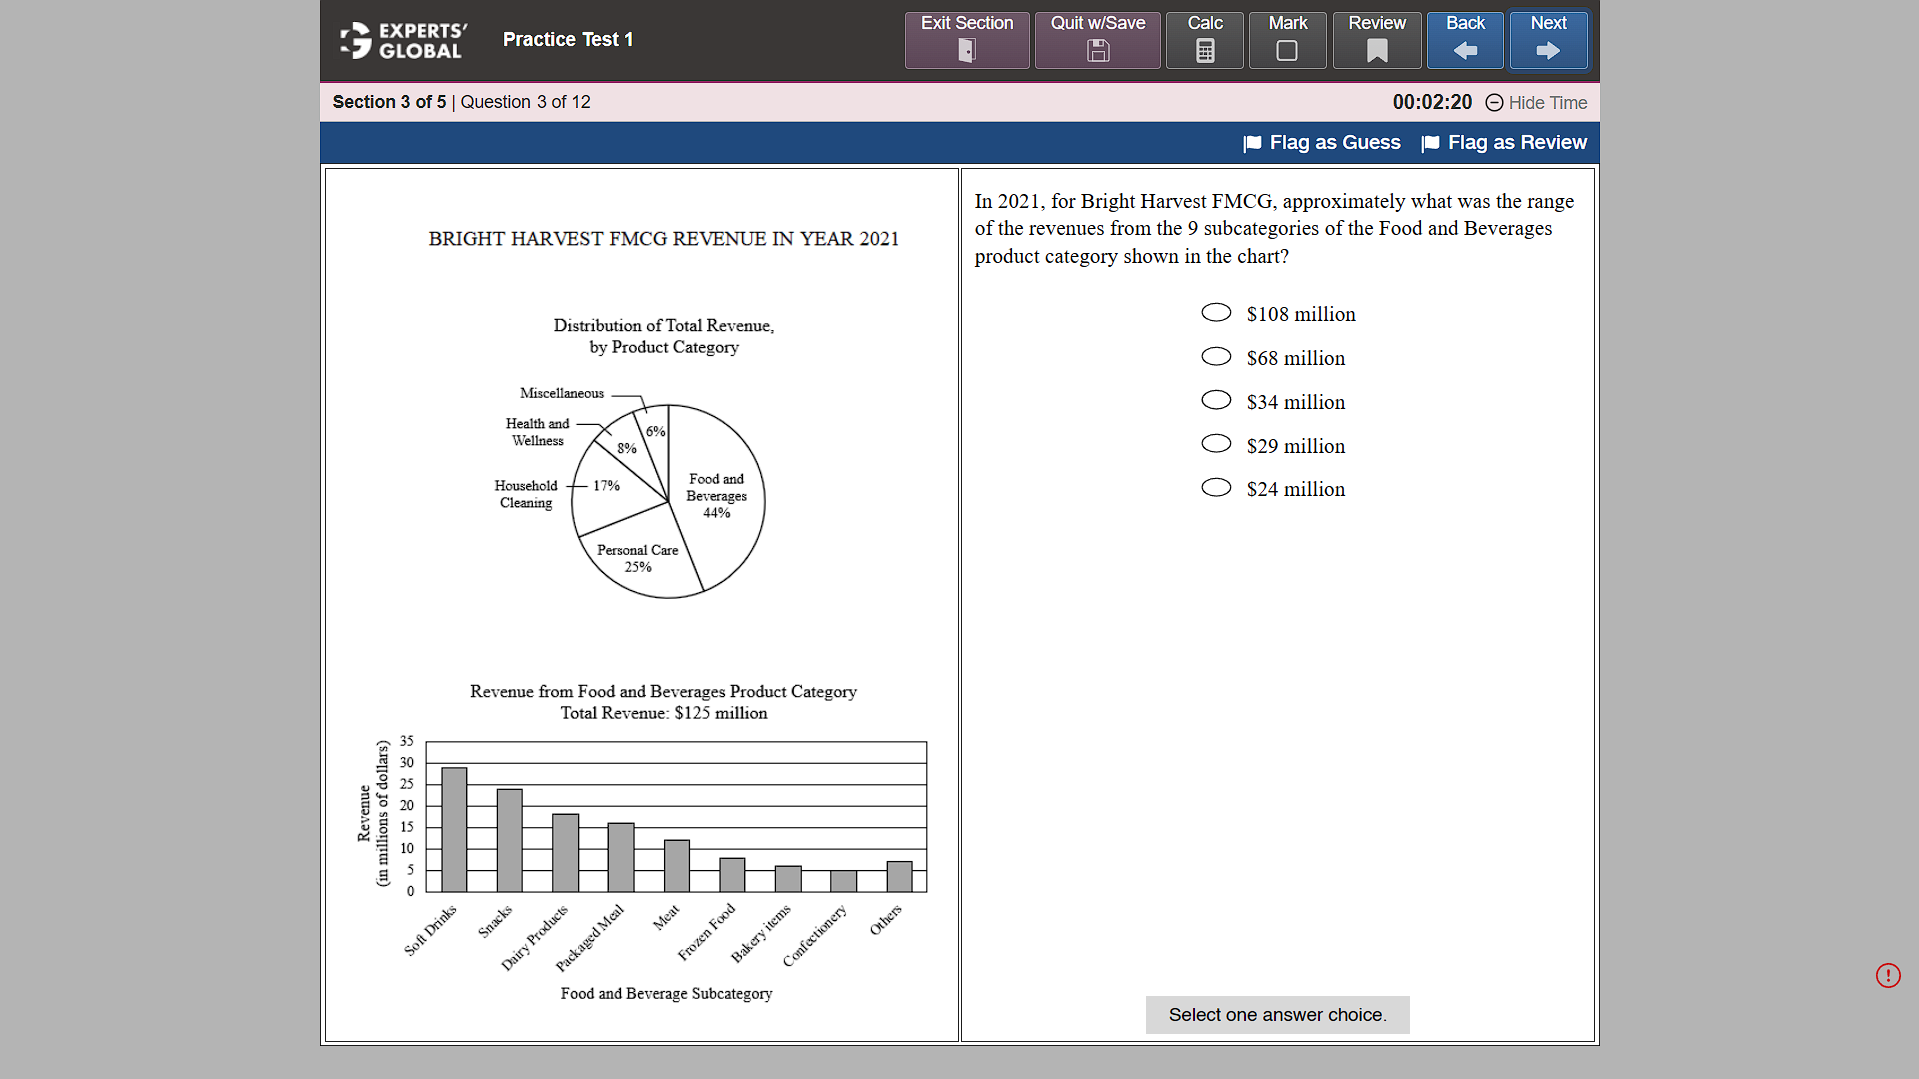
In 2021, for Bright Harvest FMCG, approximately what was the range of the revenues from the 9 subcategories of the Food and Beverages product category shown in the chart?
A. $108 million
B. $68 million
C. $34 million
D. $29 million
E. $24 million
Range is the difference between the highest value and the lowest value in a data set.
Look at the bar chart for Food and Beverage subcategories.
The tallest bar is Soft Drinks.
The revenue for Soft Drinks is approximately 29 million dollars.
The shortest bar in the chart is Confectionery.
The revenue for Confectionery is approximately 5 million dollars.
Subtract the lowest value from the highest value.
29 million – 5 million = 24 million dollars.
Correct Answer: E
Correct Answer: D
For a detailed explanation, please refer to the video presented earlier on this page.
Following is a concise, step-wise written explanation…
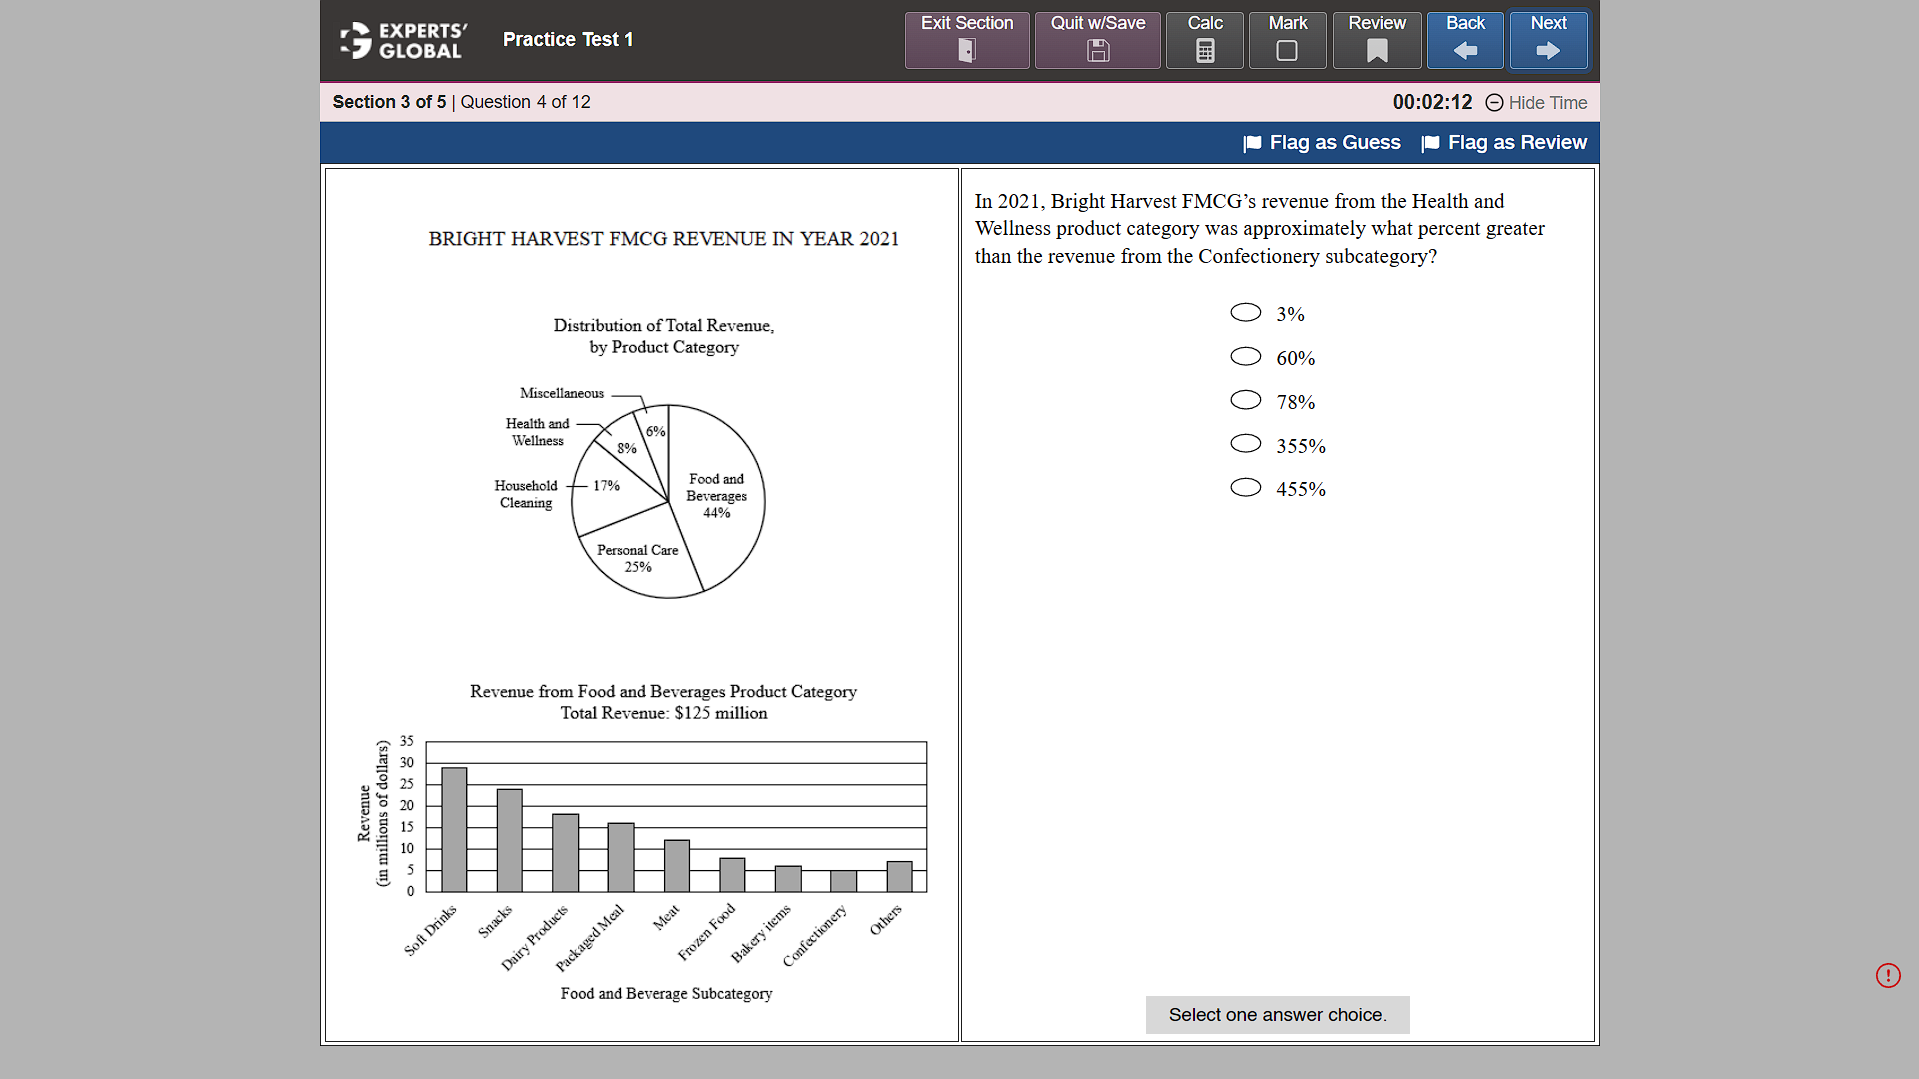
In 2021, Bright Harvest FMCG’s revenue from the Health and Wellness product category was approximately what percent greater than the revenue from the Confectionery subcategory?
A. 3%
B. 60%
C. 78%
D. 355%
E. 455%
The bar chart states that the total revenue for the Food and Beverages category is 125 million dollars. According to the pie chart, Food and Beverages represents 44% of the total revenue.
Total Revenue = 125 / 0.44 = 284.09 million dollars.
The pie chart shows Health and Wellness is 8% of the total revenue.
Health and Wellness Revenue = 0.08 * 284.09 = 22.73 million dollars.
The bar chart shows the Confectionery subcategory revenue is 5 million dollars.
Use the formula: ((Value 1 – Value 2) / Value 2) * 100.
Percent Greater = ((22.73 – 5) / 5) * 100
Percent Greater = (17.73 / 5) * 100
Percent Greater = 354.6%
The value is approximately 355%.
Correct Answer: D
Correct Answer: C only
For a detailed explanation, please refer to the video presented earlier on this page.
Following is a concise, step-wise written explanation…
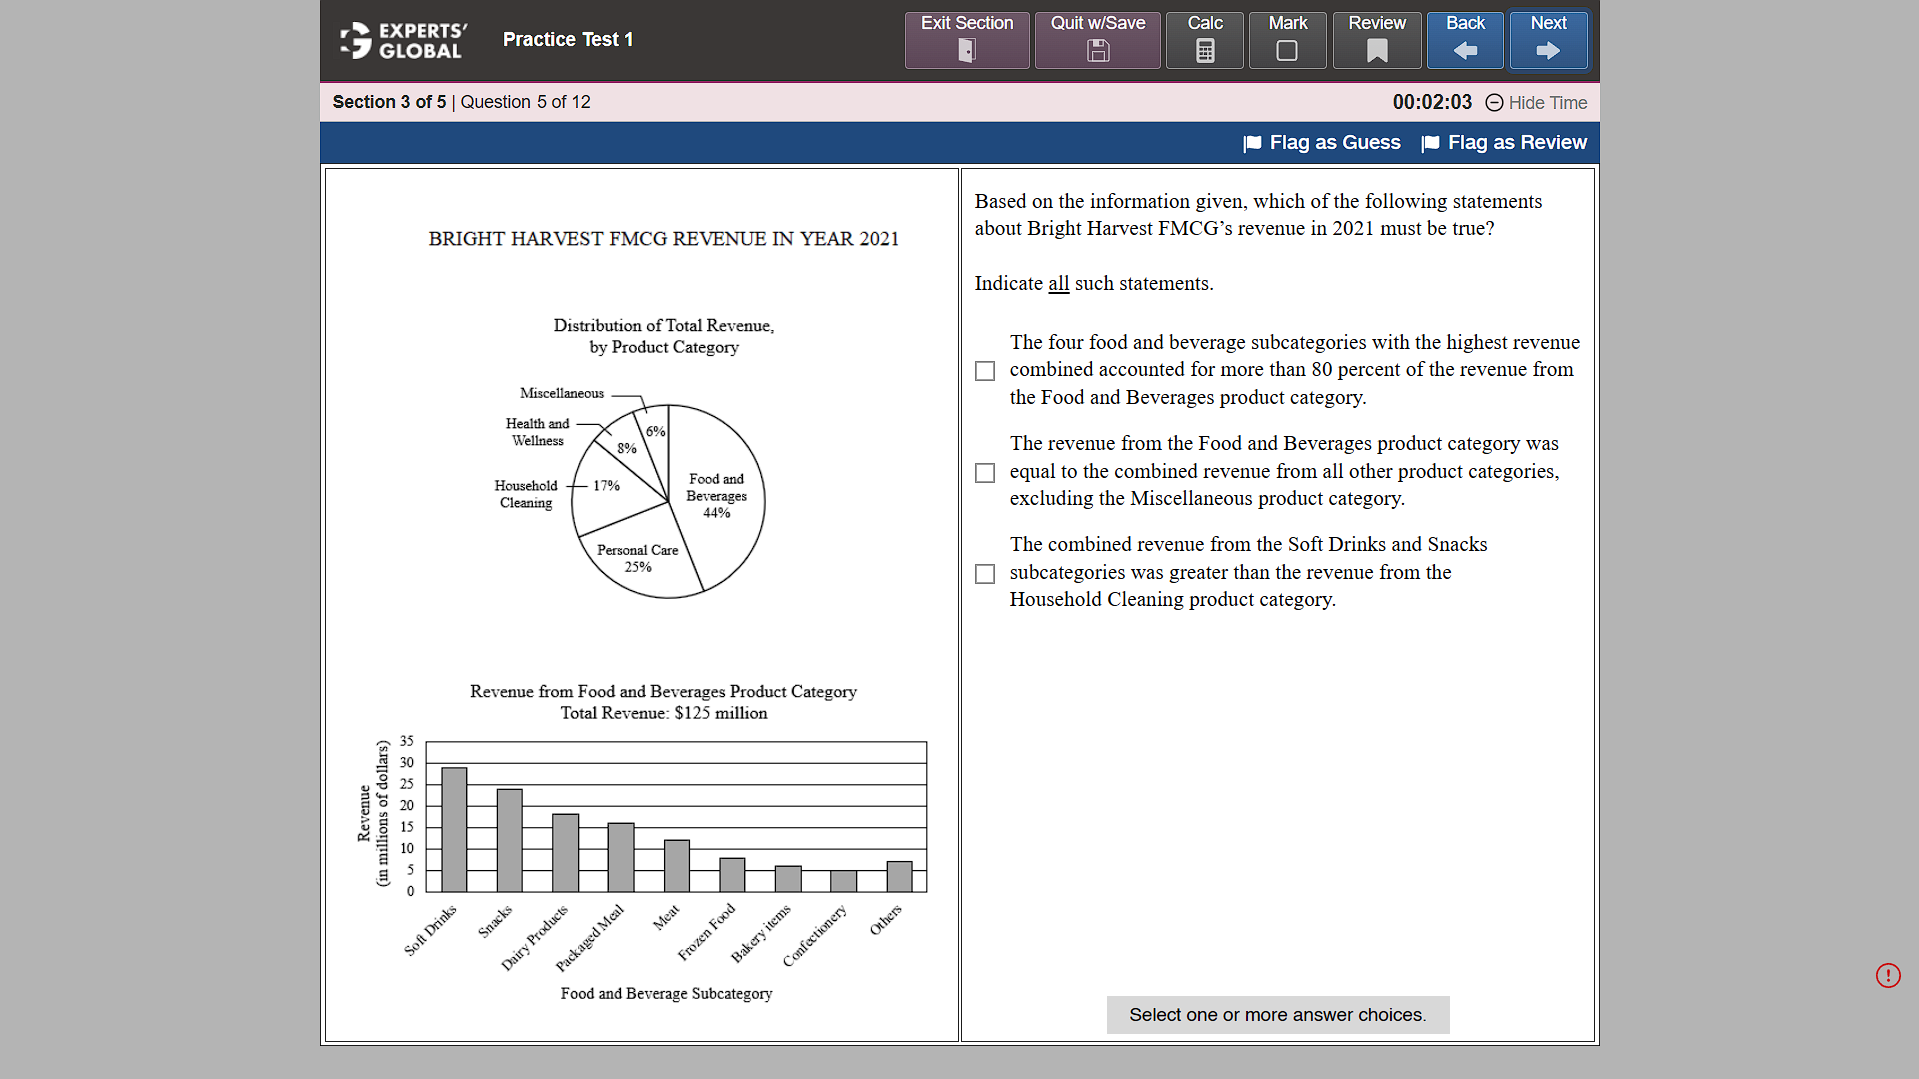
Based on the information given, which of the following statements about Bright Harvest FMCG revenue in 2021 must be true?
Indicate all such statements.
A. The four food and beverage subcategories with the highest revenue combined accounted for more than 80 percent of the revenue from the Food and Beverages product category.
B. The revenue from the Food and Beverages product category was equal to the combined revenue from all other product categories, excluding the Miscellaneous product category.
C. The combined revenue from the Soft Drinks and Snacks subcategories was greater than the revenue from the Household Cleaning product category.
The total revenue for Food and Beverages is 125 million dollars.
The top four subcategories are Soft Drinks (29), Snacks (24), Dairy Products (18), and Packaged Meal (16).
Sum of top four = 29 + 24 + 18 + 16 = 87.
Percentage = (87 / 125) * 100 = 69.6 percent.
69.6 percent is not more than 80 percent.
Statement 1 is false.
Food and Beverages accounts for 44 percent of total revenue.
Miscellaneous accounts for 6 percent.
Remaining categories = 100 percent – 44 percent (Food) – 6 percent (Misc) = 50 percent.
Statement 2 says Food (44 percent) equals the others excluding Misc (50 percent).
44 percent does not equal 50 percent.
Statement 2 is false.
Soft Drinks (29) + Snacks (24) = 53 million dollars.
Total revenue for all categories (T) can be found using Food and Beverages: 0.44 * T = 125
T = 125 / 0.44 = 284.09 million dollars.
Household Cleaning revenue = 17 percent of T = 0.17 * 284.09 = 48.3 million dollars.
53 million is greater than 48.3 million.
Statement 3 is true.
Correct Answer: C only

Correct Answer: C
For a detailed explanation, please refer to the video presented earlier on this page.
Following is a concise, step-wise written explanation…
In 2021, for Bright Harvest FMCG, Potato Chips, a part of the Snacks subcategory, accounted for 35 percent of the Snacks revenue. Approximately what percent of the total Food and Beverages product category revenue did Potato Chips contribute?
A. 2.9%
B. 3.7%
C. 6.7%
D. 8.4%
E. 15.4%
Look at the bar chart titled Revenue from Food and Beverages Category.
The total revenue for this category is 125 million dollars.
Locate the Snacks bar on the horizontal axis.
The height of the Snacks bar aligns with 24 on the vertical axis.
So, Snacks revenue is 24 million dollars.
The problem states Potato Chips are 35 percent of Snacks revenue.
35 percent of 24 is calculated as (35 / 100) * 24. 0.35 * 24 = 8.4.
Potato Chips revenue is 8.4 million dollars.
The question asks for the percent of the total Food and Beverages revenue (125 million) contributed by Potato Chips (8.4 million).
Percentage = (Potato Chips Revenue / Total Food and Beverages Revenue) * 100.
Percentage = (8.4 / 125) * 100 = 6.72 percent.
Correct Answer: C
Correct Answer: C
For a detailed explanation, please refer to the video presented earlier on this page.
Following is a concise, step-wise written explanation…
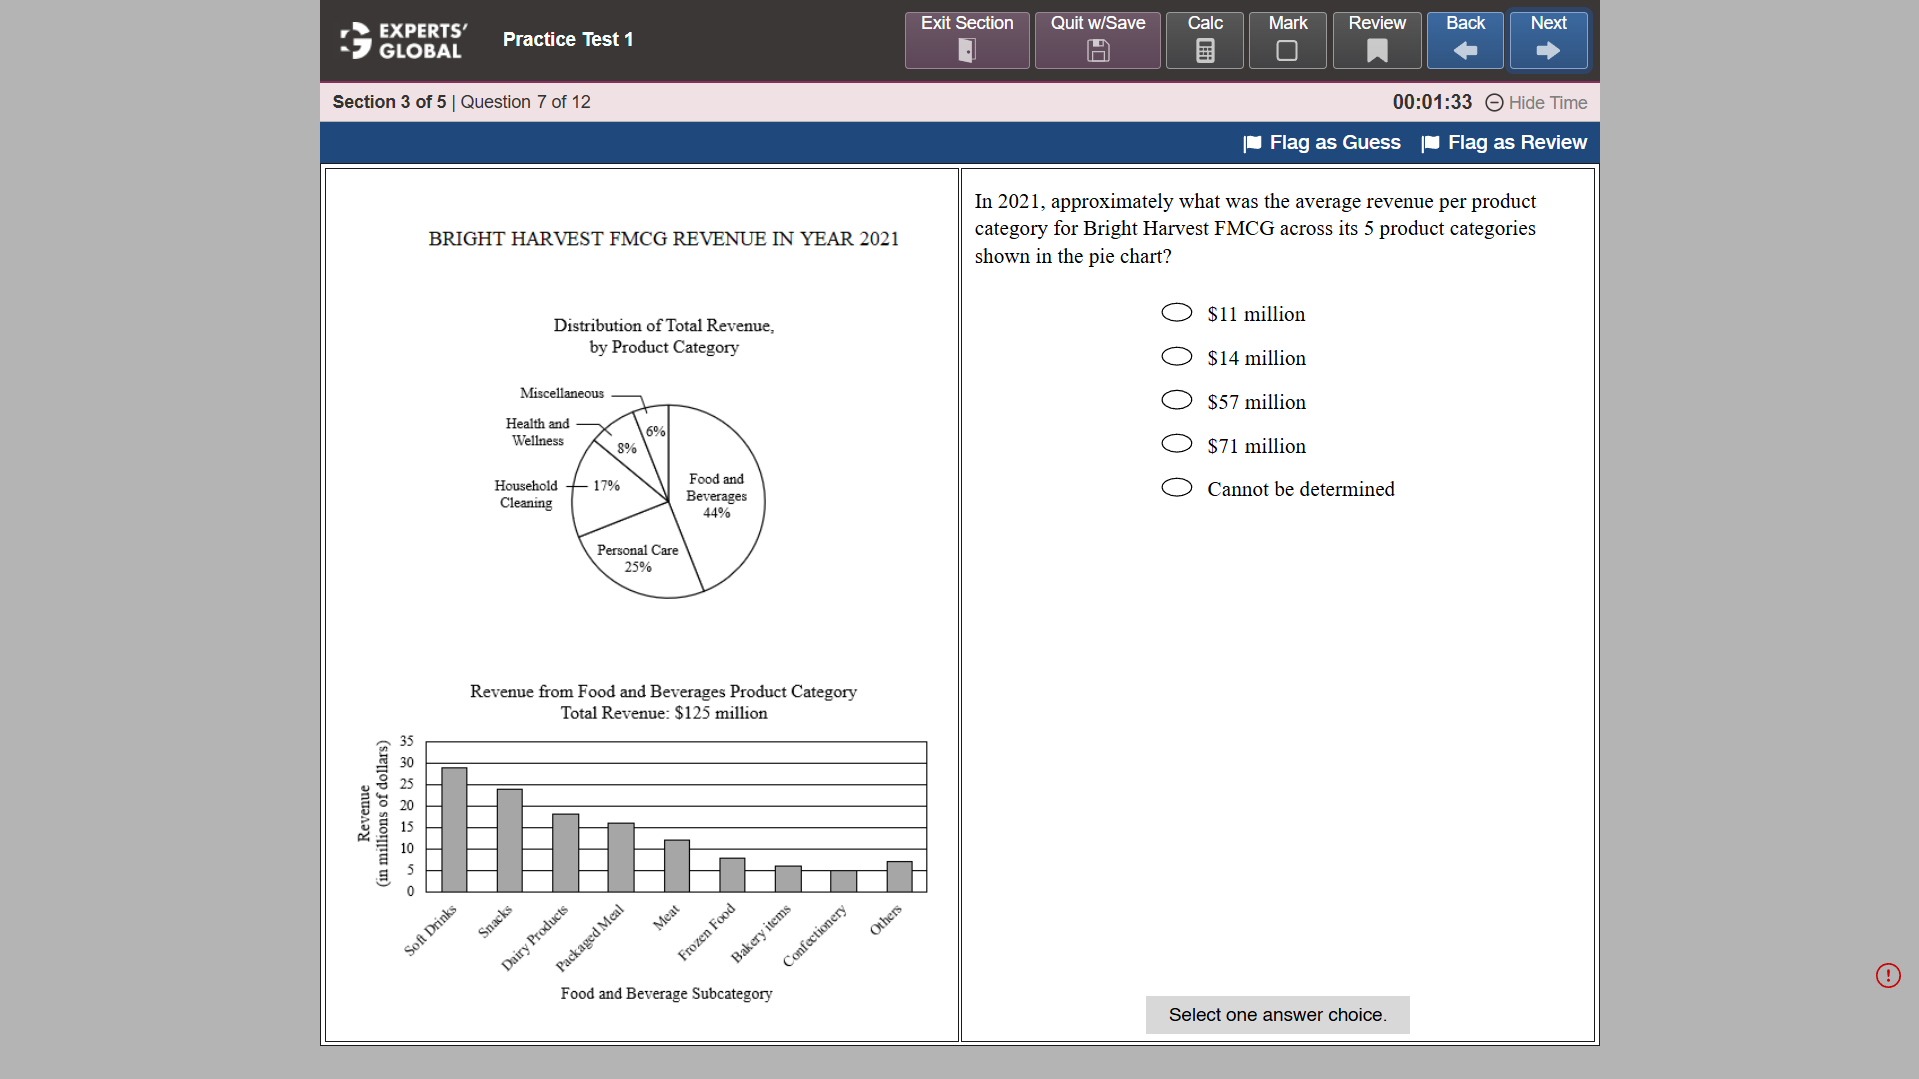
In 2021, approximately what was the average revenue per product category for Bright Harvest FMCG across its 5 product categories shown in the pie chart?
A. $11 million
B. $14 million
C. $57 million
D. $71 million
E. Cannot be determined
The bar chart states that the Total Revenue for the Food and Beverages category is $125 million.
The pie chart shows that Food and Beverages represents 44 percent of the total revenue for the entire company.
To find the total revenue for all 5 categories, we use the relationship: 44 percent of Total = $125 million.
Total = 125 / 0.44
Total is approximately $284.1 million.
There are 5 product categories shown in the pie chart.
To find the average, divide the total company revenue by 5.
Average = 284.1 / 5
Average is approximately $56.82 million.
The value $56.82 million is approximately $57 million.
Correct Answer: C
Correct Answer: B
For a detailed explanation, please refer to the video presented earlier on this page.
Following is a concise, step-wise written explanation…
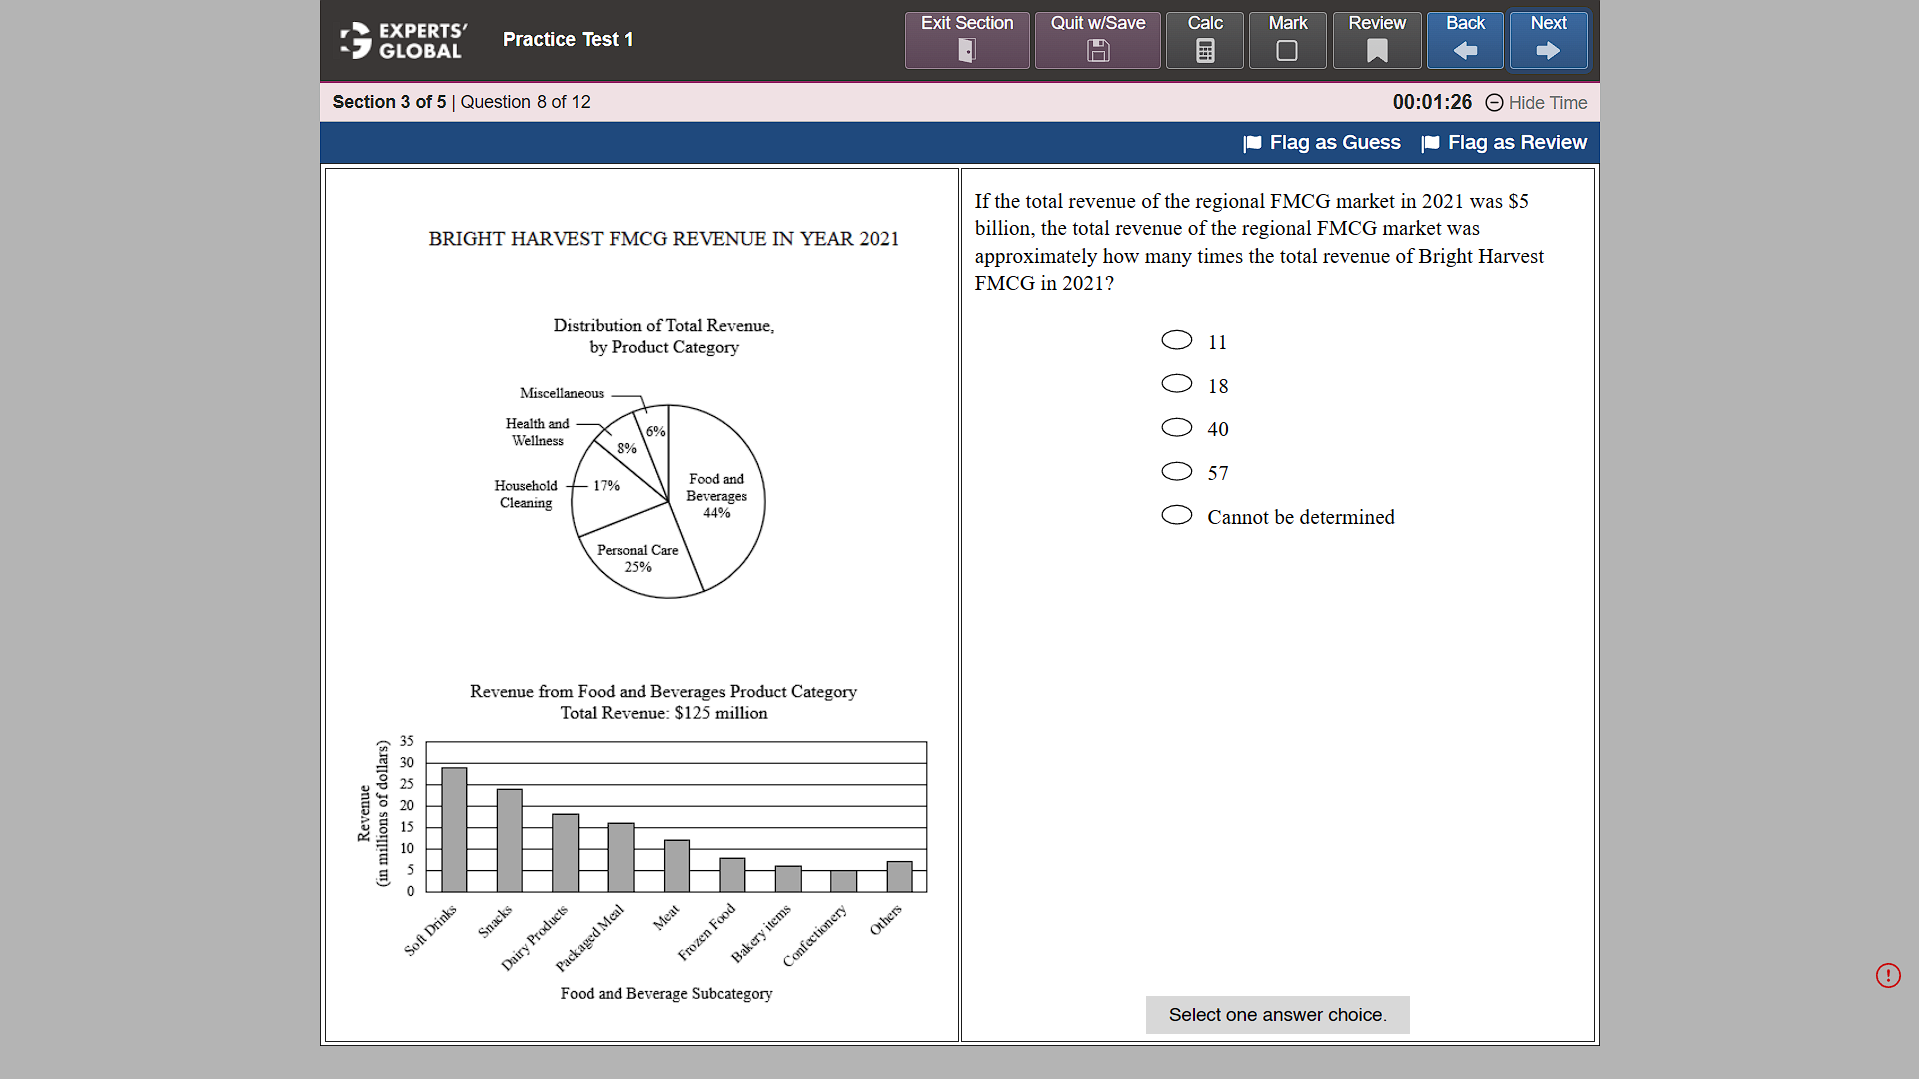
If the total revenue of the regional FMCG market in 2021 was $5 billion, the total revenue of the regional FMCG market was approximately how many times the total revenue of Bright Harvest FMCG in 2021?
A. 11
B. 18
C. 40
D. 57
E. Cannot be determined
The bar chart shows that the Food and Beverages category revenue is $125 million.
The pie chart shows that Food and Beverages accounts for 44% of the total revenue for Bright Harvest.
To find the total revenue (T): 0.44 * T = 125 million
T = 125 / 0.44
T is approximately 284 million
The regional market revenue is given as $5 billion.
1 billion = 1,000 million So, 5 billion = 5,000 million
Divide the regional market revenue by the Bright Harvest total revenue: Ratio = 5,000 / 284
Ratio is approximately 17.6
The value 17.6 is approximately 18.
Correct Answer: B

Correct Answer: C
For a detailed explanation, please refer to the video presented earlier on this page.
Following is a concise, step-wise written explanation…
In 2021, approximately what was the median revenue of the product categories for Bright Harvest FMCG shown in the pie chart, excluding the Miscellaneous product category?
A. $48 million
B. $53 million
C. $60 million
D. $71 million
E. $136 million
The bar chart states that the Food and Beverages category has a total revenue of $125 million.
According to the pie chart, this category represents 44 percent of the total revenue.
To find the total revenue: Total Revenue * 0.44 = $125 million
Total Revenue = 125 / 0.44
Total Revenue is approximately $284.1 million.
We must calculate the revenue for the four main categories, excluding Miscellaneous (6 percent).
Food and Beverages: $125 million (Given)
Personal Care: 25 percent of 284.1 = $71.0 million
Household Cleaning: 17 percent of 284.1 = $48.3 million
Health and Wellness: 8 percent of 284.1 = $22.7 million
Arrange the four revenue values in ascending order:
$22.7 million (Health and Wellness)
$48.3 million (Household Cleaning)
$71.0 million (Personal Care)
$125.0 million (Food and Beverages)
The median of an even set of numbers is the average of the two middle values ($48.3 million and $71.0 million).
Median = (48.3 + 71.0) / 2
Median = $59.65 million
This is approximately $60 million.
Correct Answer: C
Correct Answer: E
For a detailed explanation, please refer to the video presented earlier on this page.
Following is a concise, step-wise written explanation…
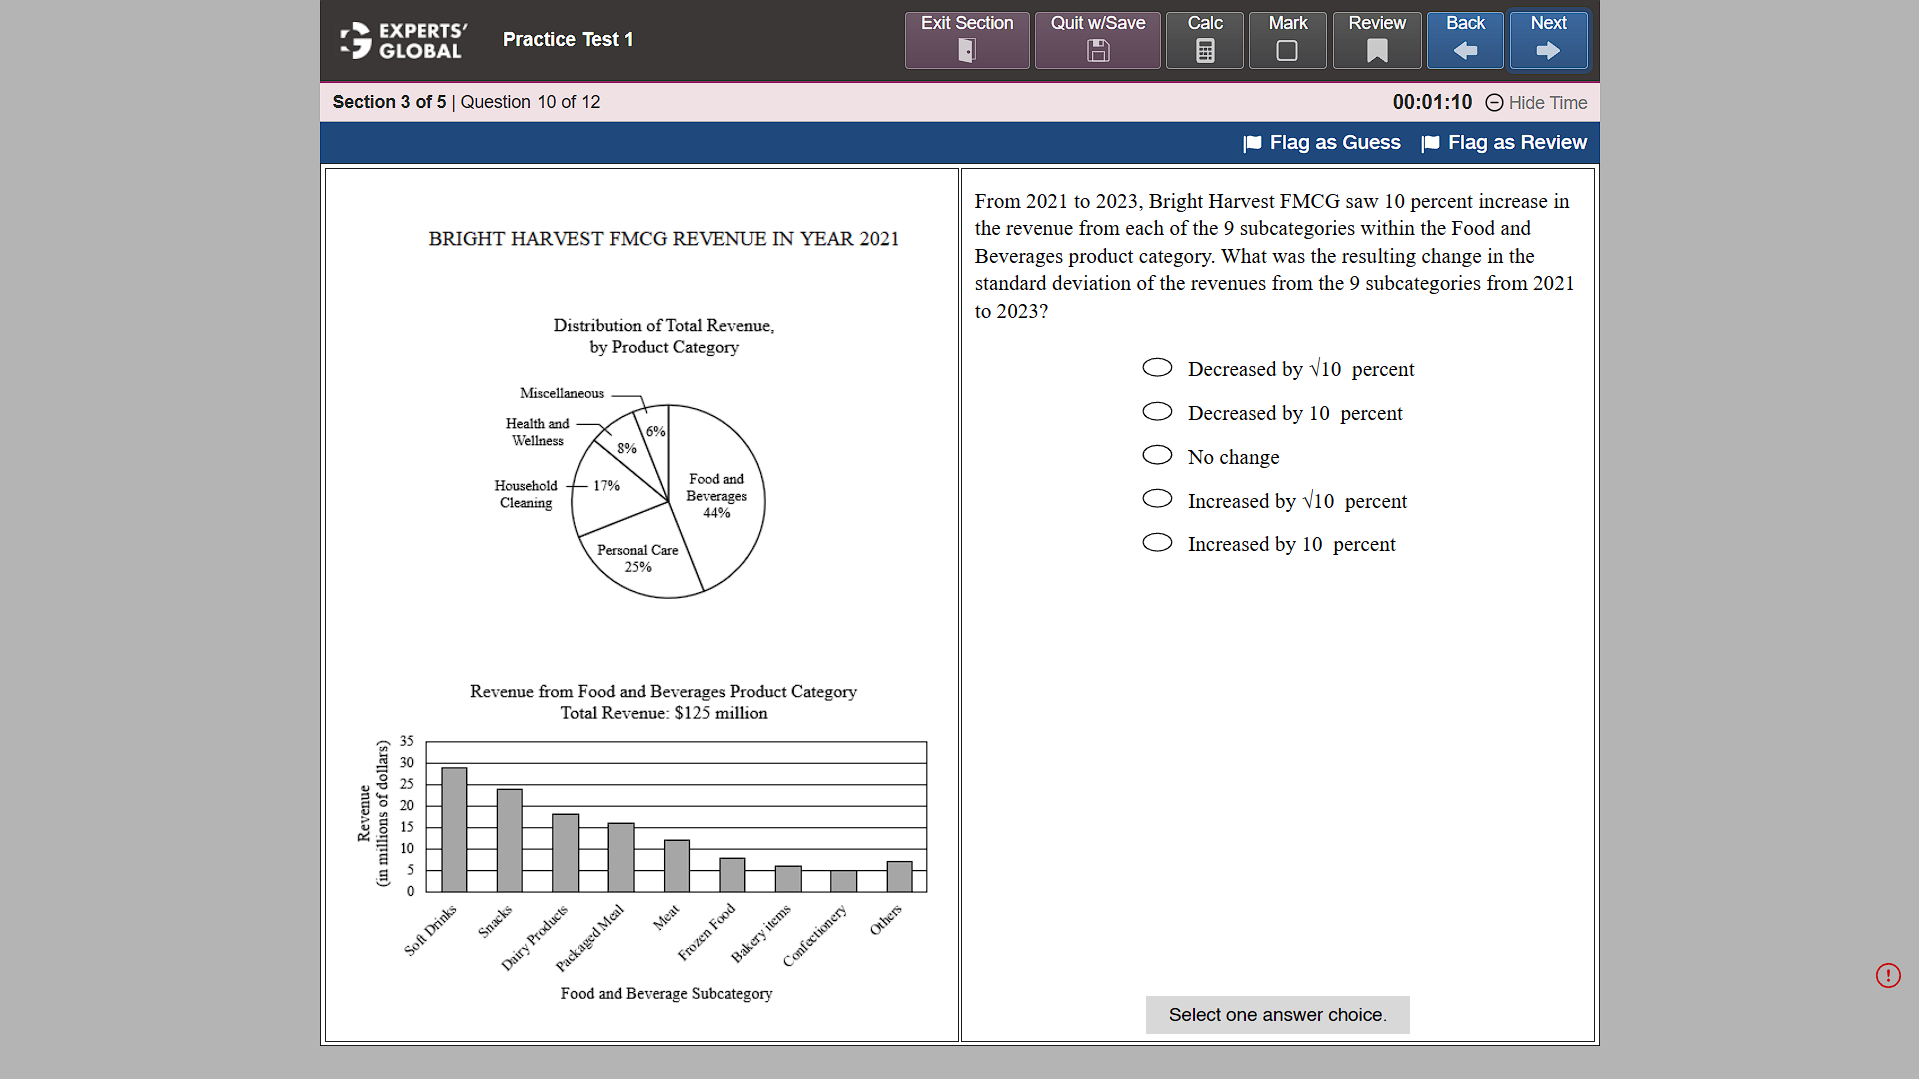
From 2021 to 2023, Bright Harvest FMCG saw 10 percent increase in the revenue from each of the 9 subcategories within the Food and Beverages product category. What was the resulting change in the standard deviation of the revenues from the 9 subcategories from 2021 to 2023?
A. Decreased by sqrt(10) percent
B. Decreased by 10 percent
C. No change
D. Increased by sqrt(10) percent
E. Increased by 10 percent
The problem states that every single data point (revenue for each of the 9 subcategories) increased by 10 percent.
This means each value was multiplied by a constant factor of 1.10.
Standard deviation measures the spread of data.
A fundamental rule of statistics is that if every value in a set is multiplied by a constant (k), the standard deviation of that set is also multiplied by the same constant (k).
Because every subcategory revenue was multiplied by 1.10 (a 10 percent increase), the standard deviation is also multiplied by 1.10.
Multiplying a value by 1.10 is equivalent to an increase of 10 percent.
Correct Answer: E

Correct Answer: B
For a detailed explanation, please refer to the video presented earlier on this page.
Following is a concise, step-wise written explanation…
In 2021, for Bright Harvest FMCG, which of the following is the closest to the ratio of the revenue from the subcategory with the highest revenue to the combined revenue from all other subcategories in the Food and Beverages product category?
A. 6/25
B. 3/10
C. 13/25
D. 2/3
E. 11/14
Looking at the bar chart for Food and Beverages, the subcategory with the highest revenue is Soft Drinks.
The bar for Soft Drinks reaches approximately 29 million dollars.
The title of the bar chart states that the Total Revenue for the Food and Beverages category is 125 million dollars.
To find the revenue of all other subcategories combined, subtract the Soft Drinks revenue from the total category revenue: 125 – 29 = 96 million dollars.
The question asks for the ratio of the highest subcategory (Soft Drinks) to all others: Ratio = 29 / 96.
29 / 96 is approximately 30 / 100, which simplifies to 3 / 10.
Correct Answer: B
Correct Answer: C
For a detailed explanation, please refer to the video presented earlier on this page.
Following is a concise, step-wise written explanation…
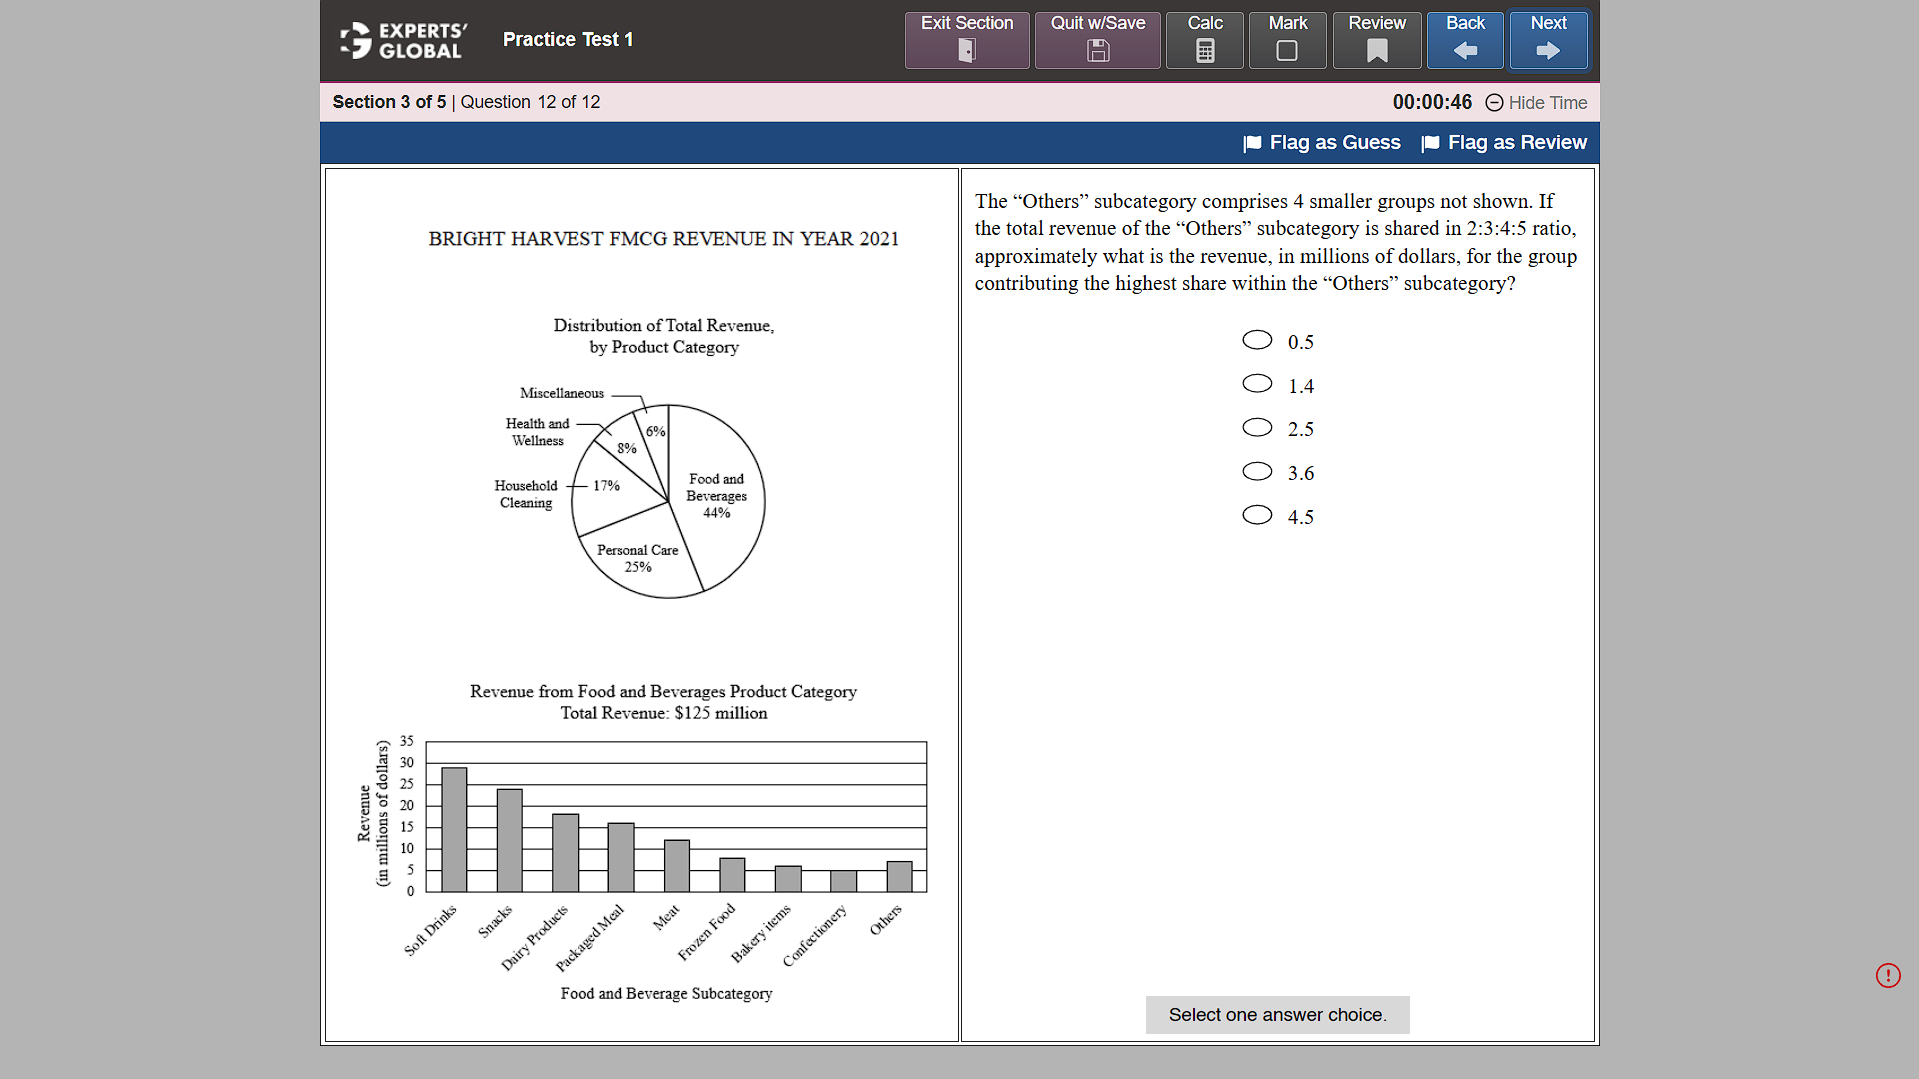
The “Others” subcategory comprises 4 smaller groups not shown. If the total revenue of the “Others” subcategory is shared in 2:3:4:5 ratio, approximately what is the revenue, in millions of dollars, for the group contributing the highest share within the “Others” subcategory?
A. 0.5
B. 1.4
C. 2.5
D. 3.6
E. 4.5
Look at the bar chart titled Revenue from Food and Beverages Category.
Locate the bar labeled Others on the far right. T
he height of this bar aligns with the 7 mark on the vertical axis.
Therefore, the total revenue for the Others subcategory is 7 million dollars.
The revenue is split into four groups with the ratio 2:3:4:5.
To find the total number of parts, add these numbers together: 2 + 3 + 4 + 5 = 14 parts.
The group with the highest share is represented by the largest number in the ratio, which is 5.
This group receives 5 out of the 14 total parts.
Multiply the total revenue of the subcategory by the fraction of the highest share: (5 / 14) * 7 million dollars
= 2.5 million dollars.
Correct Answer: C
Online GRE prep course with 7 day free access
Free diagnostic full length GRE mock test
