
Invest 30 seconds...
...for what may lead to a life altering association!
Help Line
- +91.8800.2828.00 (IND)
- 1030-1830 Hrs IST, Mon-Sat
- support@expertsglobal.com
33% off ends soon:GMAT/GRE prep + applications bundle. Profile building, longer mentoring, better results. Inquire
Graphics Interpretation (GI) questions ask you to understand information shown through visual formats such as bar charts, line graphs, pie charts, or scatter plots, and then use that information to answer reasoning-based questions. On the GMAT, you can expect 3 or 4 Graphics Interpretation questions among the 20 questions in the Data Insights section. These questions generally require multiple responses, and you receive credit only if all your selected responses are correct, with no partial credit. They help you practise reading patterns, comparing values, and drawing clear conclusions from visual data. Proper familiarity with this question type is an essential part of any comprehensive GMAT preparation course. This page provides you an organized subtopic wise playlist, along with a few worked examples, for efficient preparation of this concept.
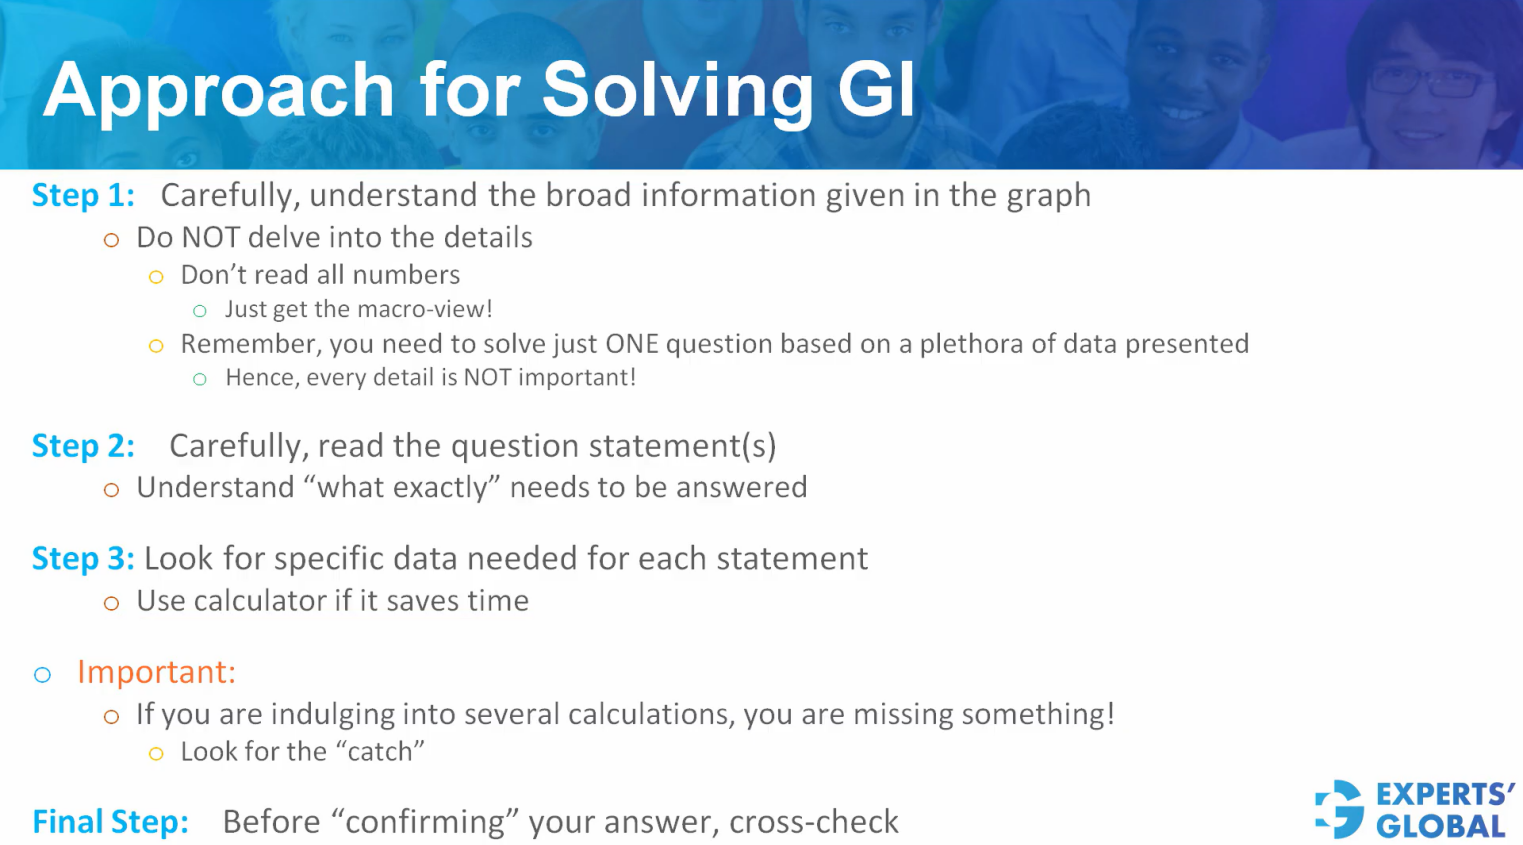
The following brief video walks you through a structured way to solve Graphics Interpretation questions on the GMAT. It shows how to follow each step steadily, even when you are working under actual exam conditions and strict time limits.

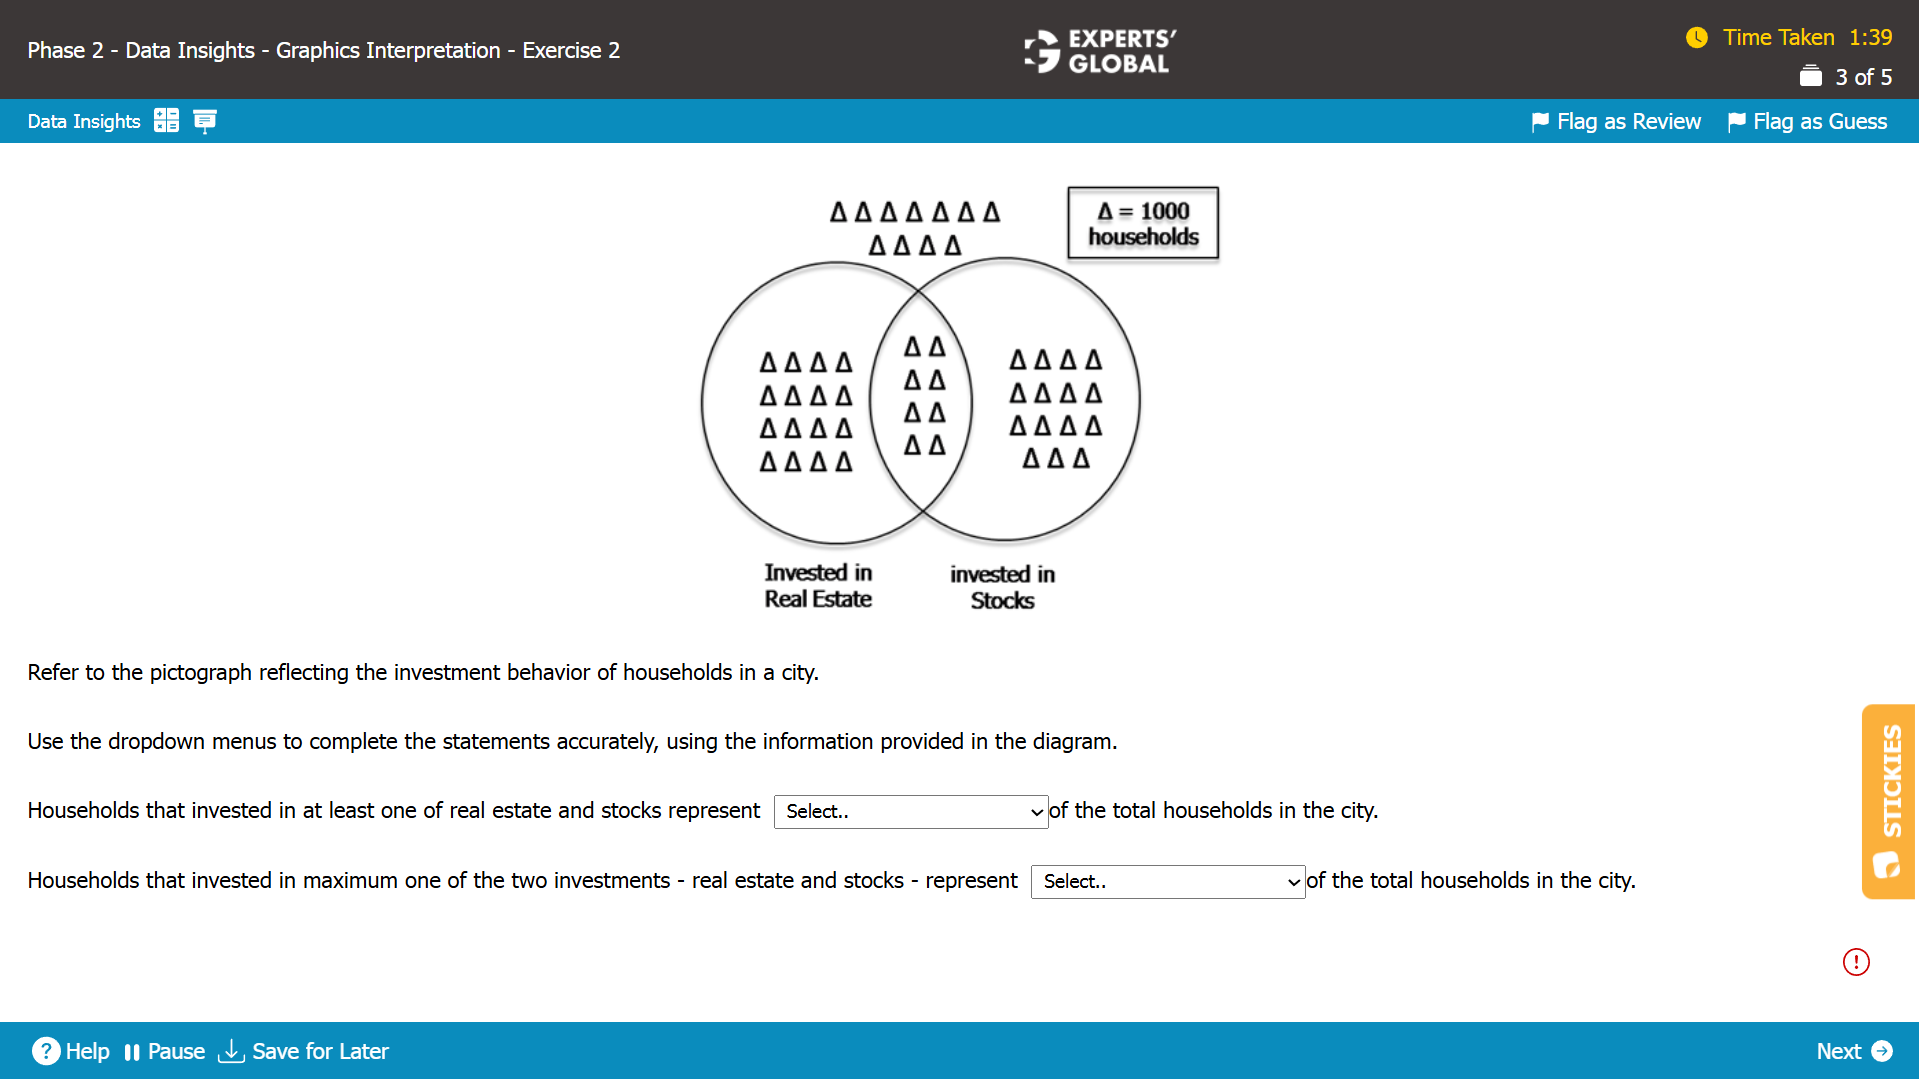
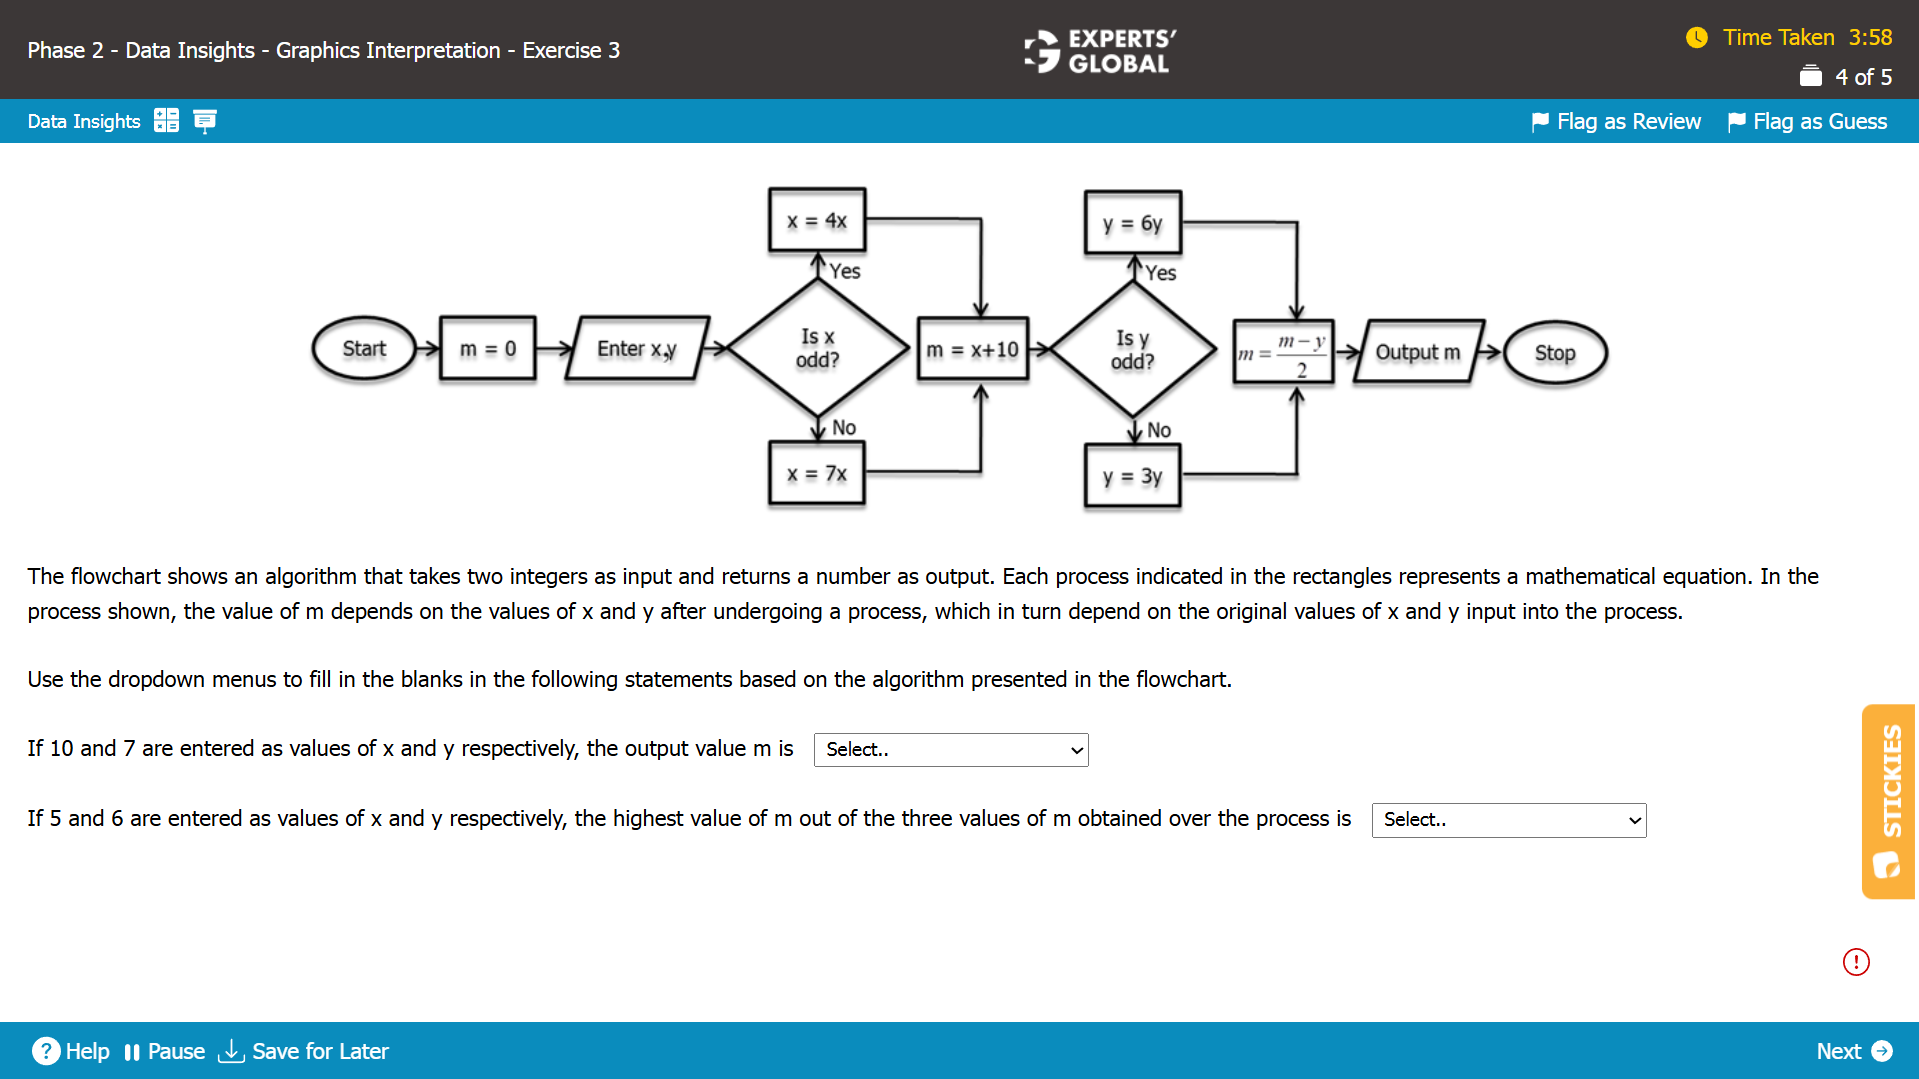
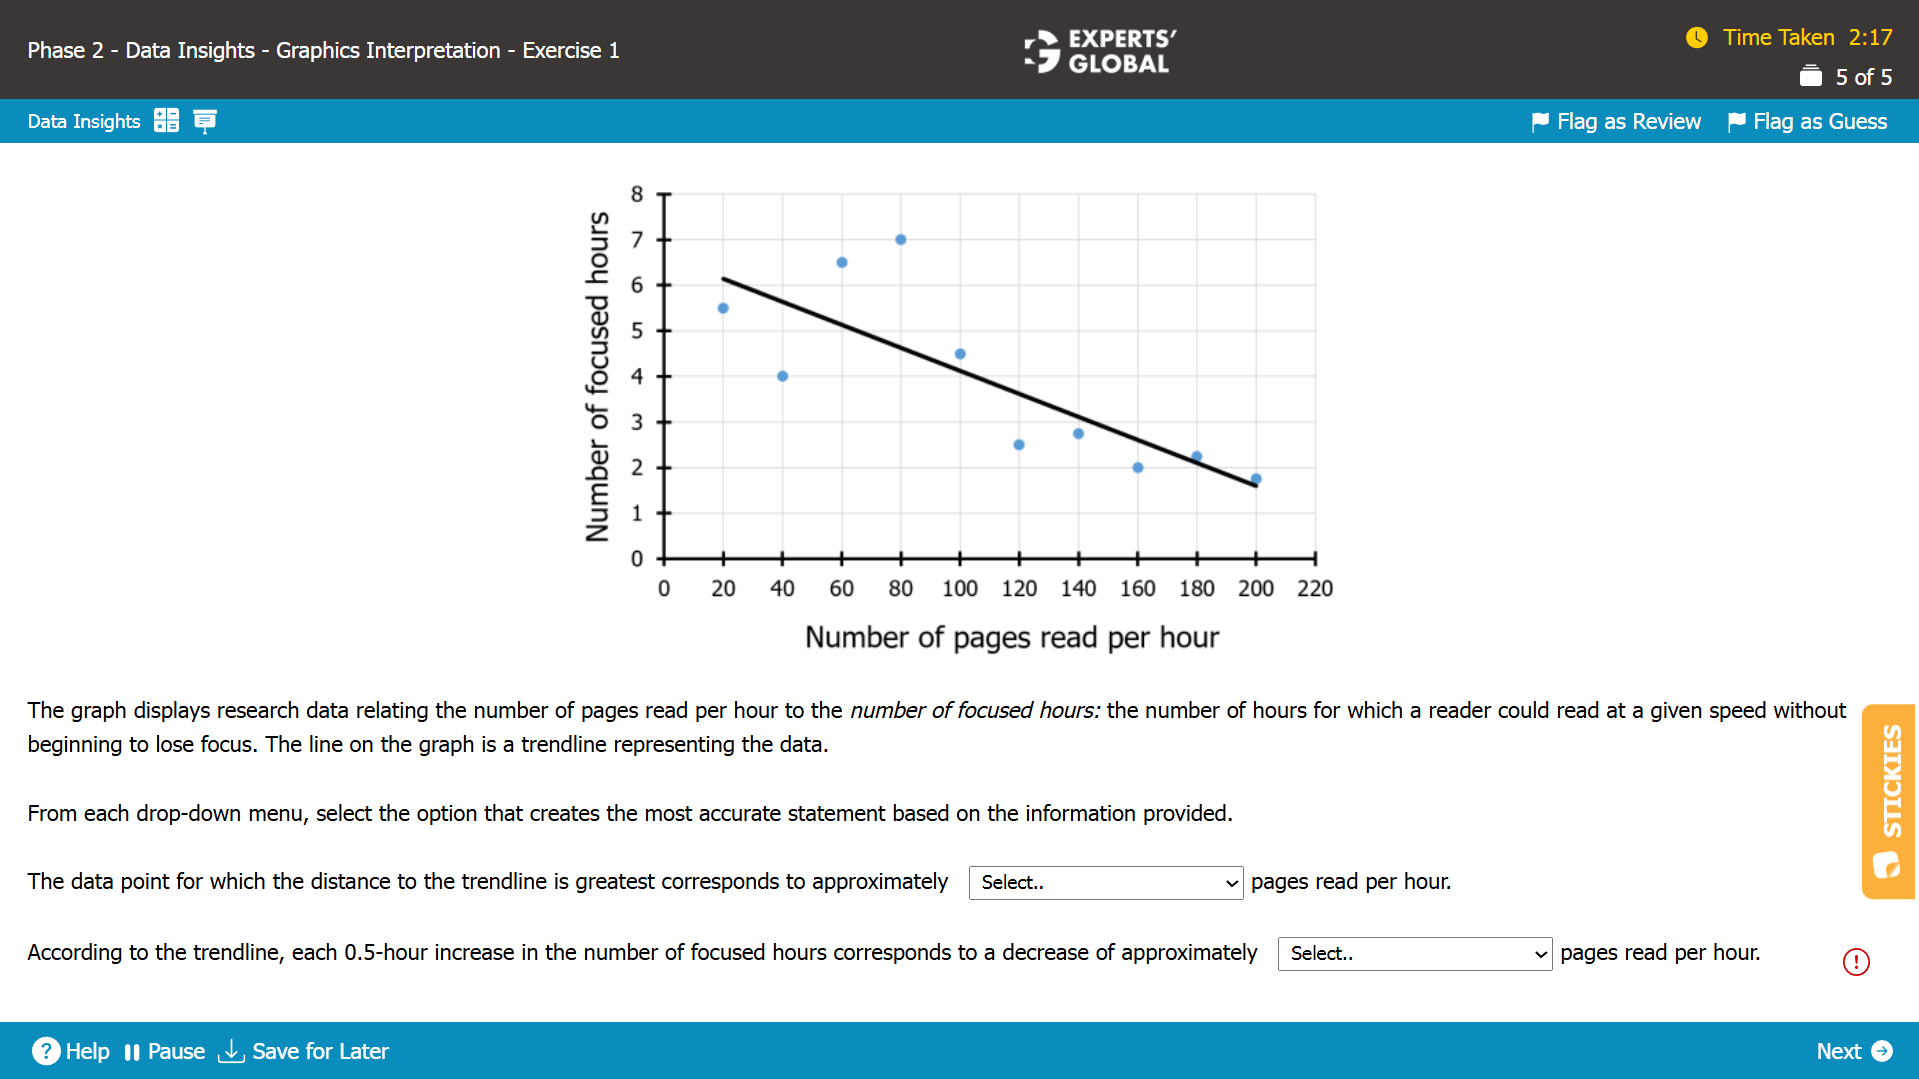
This section presents a set of authentic GMAT-style Graphics Interpretation questions, each accompanied by a detailed explanation. Work through every question at a steady pace and consciously use the approach and ideas you have just studied on this page for handling Graphics Interpretation on the GMAT. For now, give priority to applying the method accurately rather than only aiming for a correct answer. After you complete a question, use the explanation button to view the correct answer and read the full descriptive reasoning.
Real practice for Graphics Interpretation problems begins when you solve them on a software simulation that closely matches the official GMAT interface. You need a platform that presents the graph or chart, the question stem, and the answer choices in a GMAT like layout, lets you work with the information and options naturally, and provides all the on screen tools and functionalities that you will see on the actual exam. Without this kind of experience, it is difficult to feel fully prepared for test day. High quality Graphics Interpretation questions are not available in large numbers. Among the limited, genuinely strong sources are the official practice materials released by GMAC and the Experts’ Global GMAT course.
Within the Experts’ Global GMAT online preparation course, every Graphics Interpretation problem appears on an exact GMAT like user interface that includes all the real exam tools and features. You work through more than 40 Graphics Interpretation questions in quizzes and also take 15 full-length GMAT mock tests that include several Graphics Interpretation questions in roughly the same spread and proportion in which they appear on the actual GMAT.
All the best!
