Mean or average gives the central value of a set of numbers, median identifies the middle value when the numbers are arranged in order, and mode highlights the value that appears most often. Range measures the spread between the highest and lowest values, variance captures how far the numbers are from the average, and standard deviation expresses this spread in a more interpretable form. These concepts work together to describe data in a clear and structured way, and proper coverage of them is an essential part of a comprehensive GMAT preparation course. This page offers you an organized subtopic-wise playlist, along with a few worked examples, for efficient preparation of this concept.
Arithmetic Mean or Average on GMAT
The idea of averages, or the arithmetic mean, may look straightforward, yet it is one of the most frequently tested concepts in aptitude and competitive exams. It is much more than simply dividing a total by the number of terms. Average based questions check your ability to notice patterns, apply rules consistently, and stay away from subtle traps. For example, if every term in a set increases or decreases by the same amount, the mean also changes by exactly that amount. In the same way, when each term is multiplied or divided by a number, the mean transforms in the same manner. This makes averages a powerful tool for quick mental calculations. Students sometimes confuse the mean with the median or the mode, but there is no fixed order among them. Depending on the data, any one of these measures can be the largest or the smallest. In the following short video, this approach is illustrated, explained, and made ready for use in GMAT drills, sectional tests, and full-length GMAT diagnostic tests.

Arithmetic Mean or Average on GMAT
Mode on GMAT
Among the three measures of central tendency, mean, median, and mode, the mode is often the easiest to grasp yet the least explored. While the mean captures balance and the median marks the middle, the mode focuses on repetition. It singles out the value that appears most frequently in a set of data. This makes it especially valuable when studying test scores, customer choices, or patterns where repeated outcomes matter. For instance, in a list of exam scores, the score that occurs most often is the mode. If two or more values share the same highest frequency, the data has multiple modes. This possibility of more than one mode often surprises students, but it is an entirely natural situation in quantitative analysis. The short video below lays out the concept and gives examples of how it can be examined on the GMAT.
Among the three central measures of data, mean, median, and mode, the median plays a special part. While the mean represents the overall balance of the list, the median pinpoints the middle value, splitting the data into two equal halves. To locate it, first arrange the numbers in order. If there is an odd number of terms, choose the single middle value; if there is an even number of terms, take the average of the two central values. In this concise video, you will see the concept explained and illustrated through GMAT style testing.
Standard Deviation on GMAT
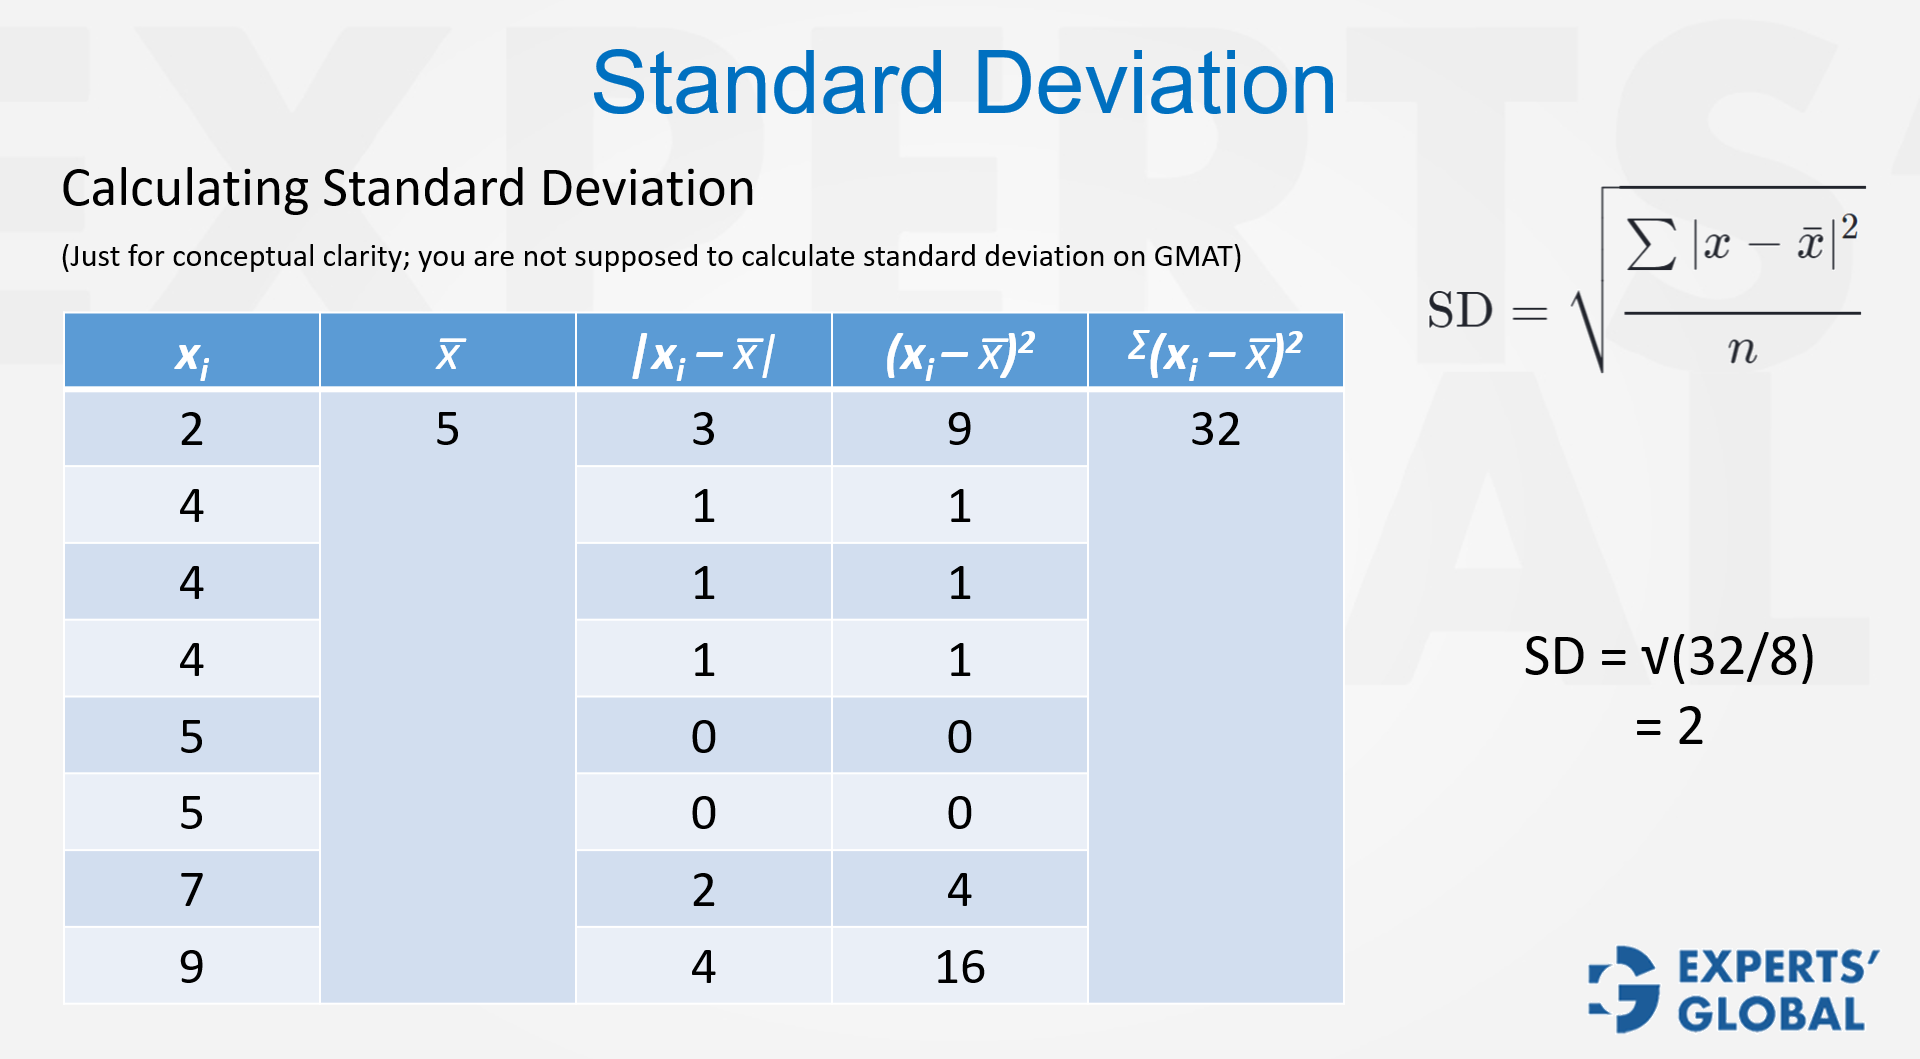
Standard deviation is one of the key measures of variability in statistics, and it often appears in both GMAT Quantitative Reasoning and GMAT Data Insights questions. The GMAT will not ask you to carry out long, detailed computations to find the standard deviation of a dataset, but you must clearly understand how it behaves and how it responds when a dataset changes. The exam checks whether you can think about the spread of data, not just work with averages. For instance, a set with a higher standard deviation has values that lie more widely away from the mean, while a lower standard deviation shows that the values stay close together. You also need to be clear on how simple operations, such as adding, subtracting, multiplying, or dividing every element by a constant, affect the standard deviation. This depth of understanding guards you against small but costly errors. The following short video walks through this idea and shows exactly how it may be tested on the GMAT.
Standard Deviation on GMAT
Range and Variance on GMAT
Grasping how data is distributed is central to both Quantitative Reasoning and Data Insights on the GMAT. Two of the simplest tools for understanding this spread are range and variance. GMAT questions often test these ideas, not through heavy computation, but by seeing whether you can think about data in a clear, precise way. The range is the most basic measure of variability, capturing the gap between the largest and smallest values in a set. Variance, which is the square of the standard deviation, offers a richer picture of how all the values are dispersed across the dataset. While the range is quick to calculate, variance delivers a deeper mathematical sense of diversity. Both concepts are simple to learn yet very powerful once you truly make them your own. The short video that follows presents this idea in a straightforward way and illustrates how the GMAT can test it.
Range and Variance on GMAT
GMAT-style Statistics Questions with Explanations
In this practice set, you will solve a series of GMAT-style Statistics questions, each accompanied by a comprehensive, stepwise explanation. Move through the questions steadily and make a conscious effort to apply the ideas and procedures you have just studied on this page for tackling Statistics questions on the GMAT. At this stage, give more importance to following the method faithfully than to simply arriving at the correct answer. After attempting each problem, use the explanation toggle to view the right option and to study the reasoning in a clear, descriptive manner.
Practice Question 1
Written Explanation
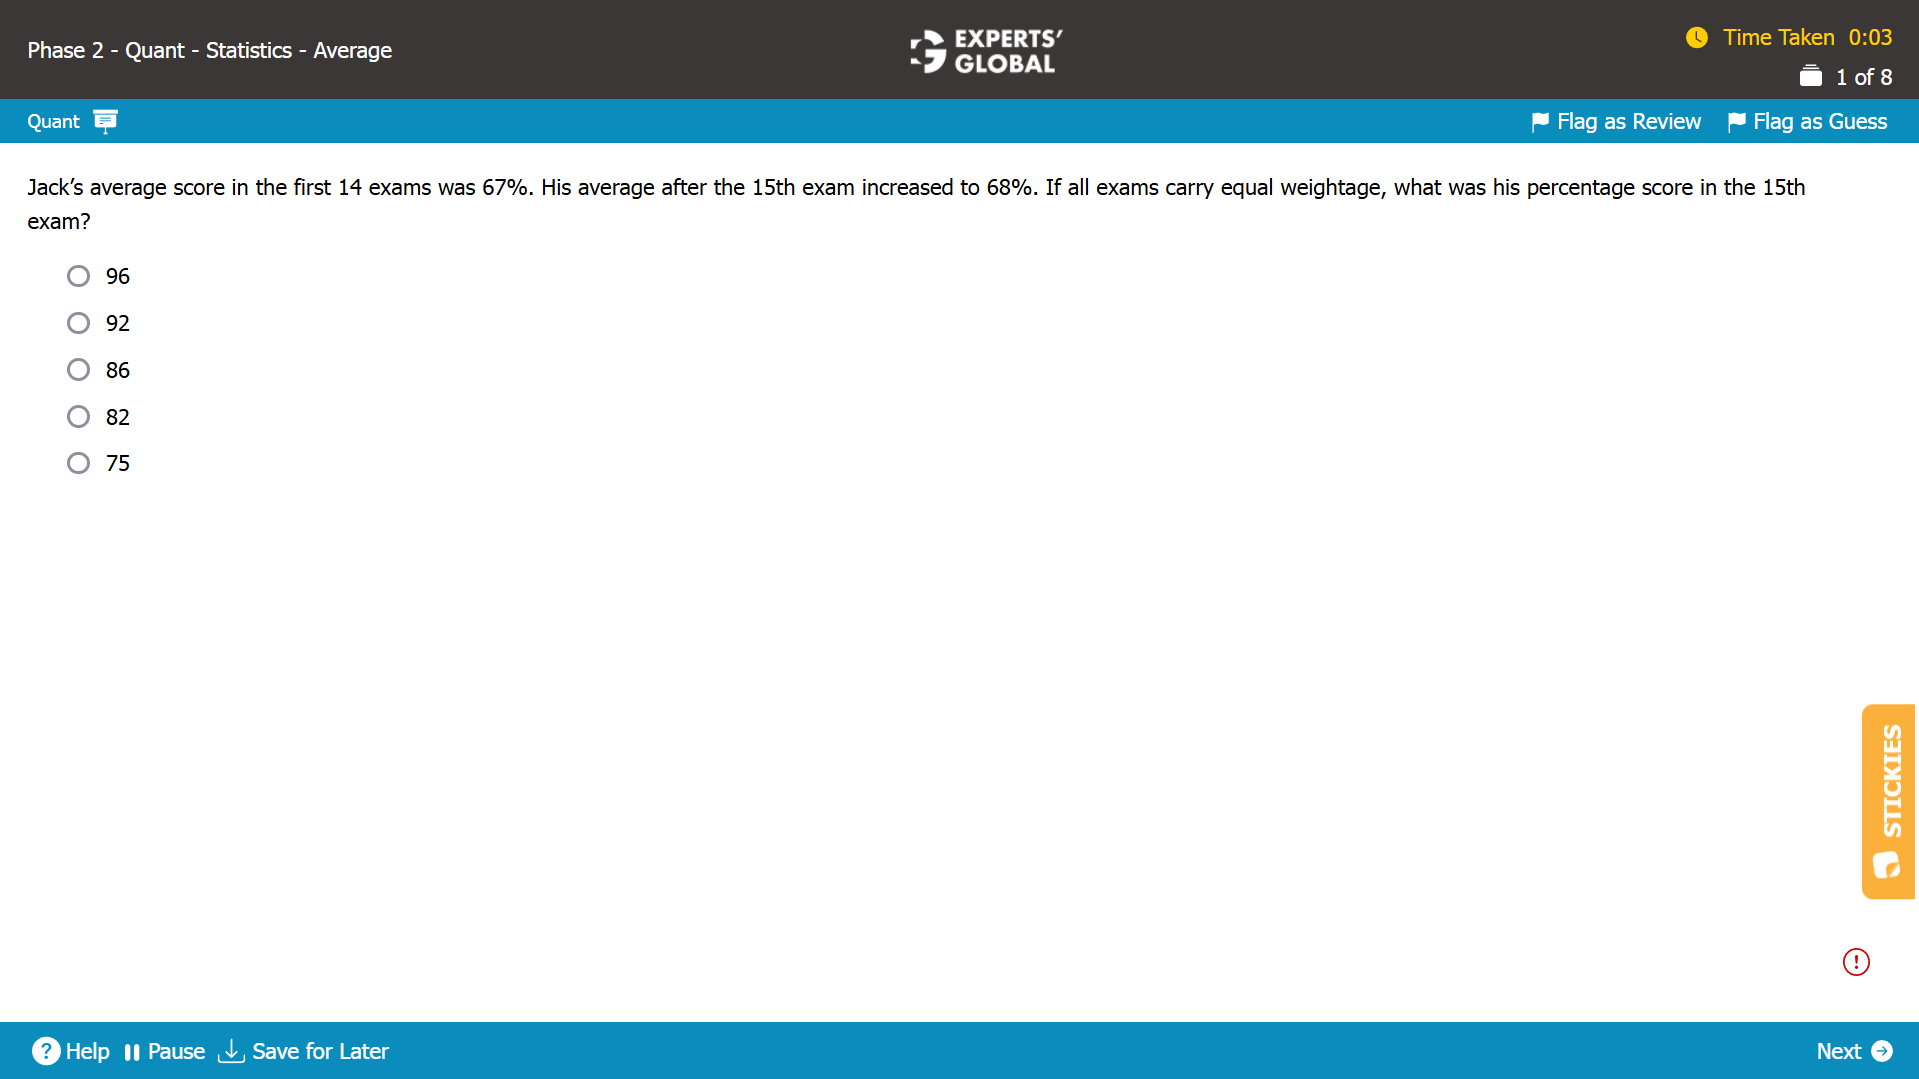
The average of the first 14 exams = 67%.
So, the total score of the first 14 exams = 67 X 14 = 938.
The average of the 15 exams = 68%.
So, the total score of the 15 exams = 68 X 15 = 1020.
Jack’s score in the 15th exam = total score of the 15 exams – total score of the first 14 exams = 1020 – 938 = 82%.
D is the correct answer choice.
Practice Question 2
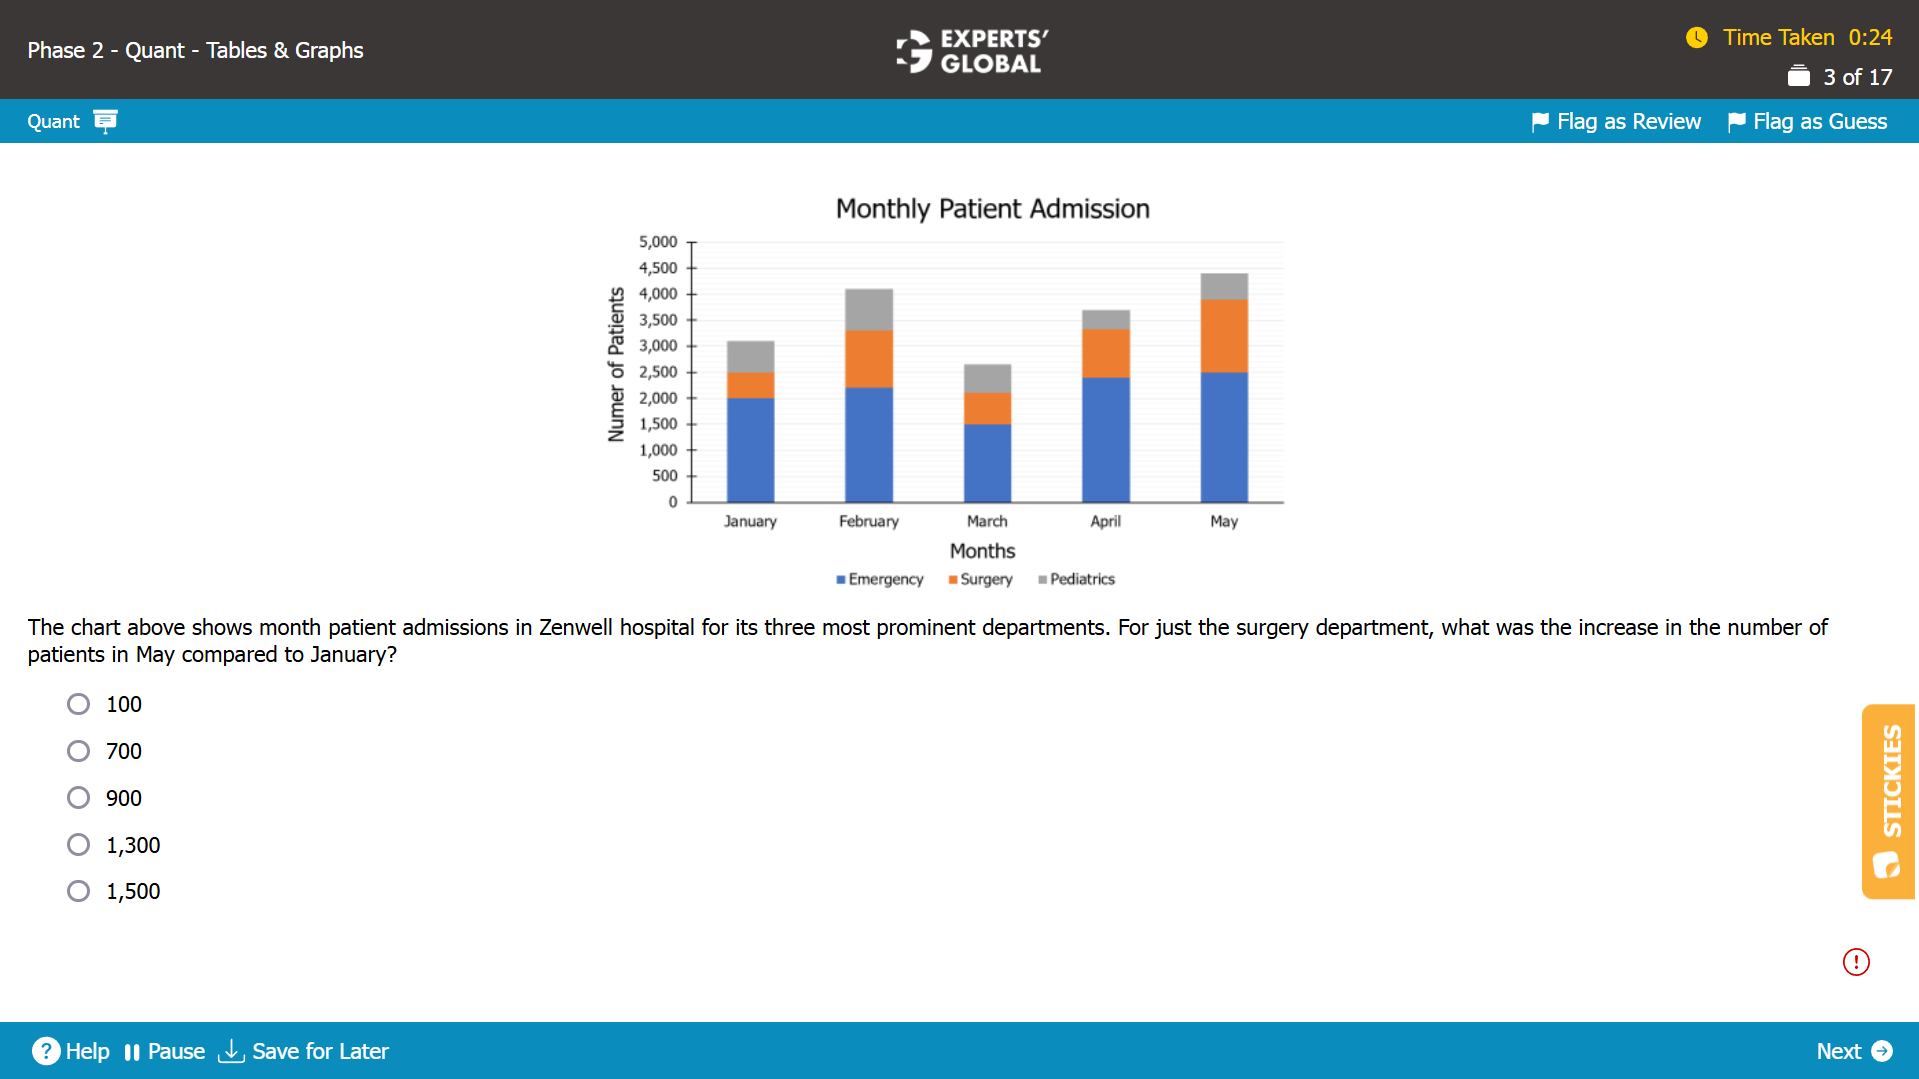
We need to determine, for just the surgery department, what the increase in the number of patients was in May compared to January.
From the graph, the number of patients admitted to the surgery department in January = 2,500 – 2,000 = 500.
From the graph, the number of patients admitted to the surgery department in May = 3,900 – 2500 = 1,400.
The increase in the number of patients admitted = 1,400 – 500 = 900.
Hence, for just the surgery department, the increase in the number of patients in May compared to January was 900.
C is the correct answer choice.
Practice Question 3
Written Explanation
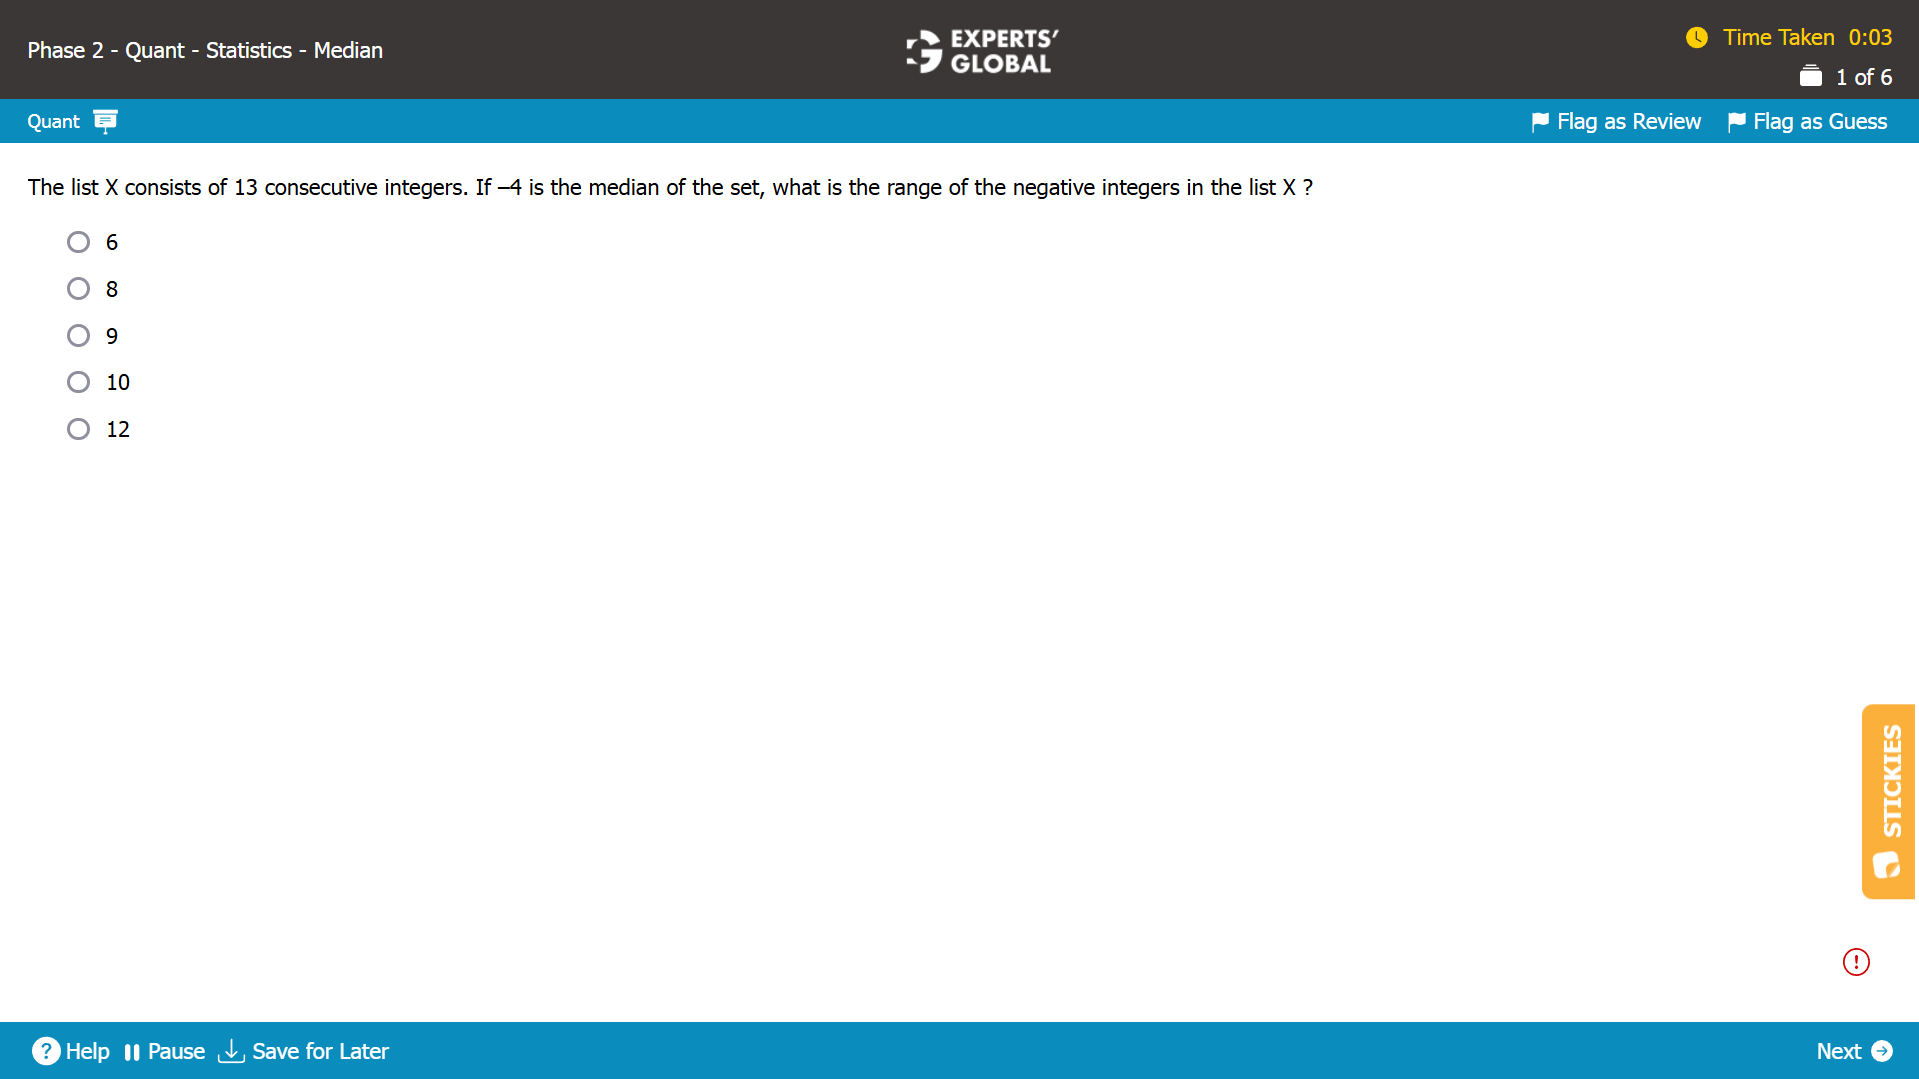
Let’s consider the set of 13 consecutive integers.
The median is –4. The median will be the 7th integer, when the set is arranged in ascending order. So, the set would look as follows.
{–10,–9,–8,–7,–6,–5,–4,–3,–2,–1,0,1,2}
The subset of negative integers would look as follows.
{–10,–9,–8,–7,–6,–5,–4,–3,–2,–1}
The range of this subset of negative integers would be (–1) – (–10) = 9.
C is the correct answer choice.
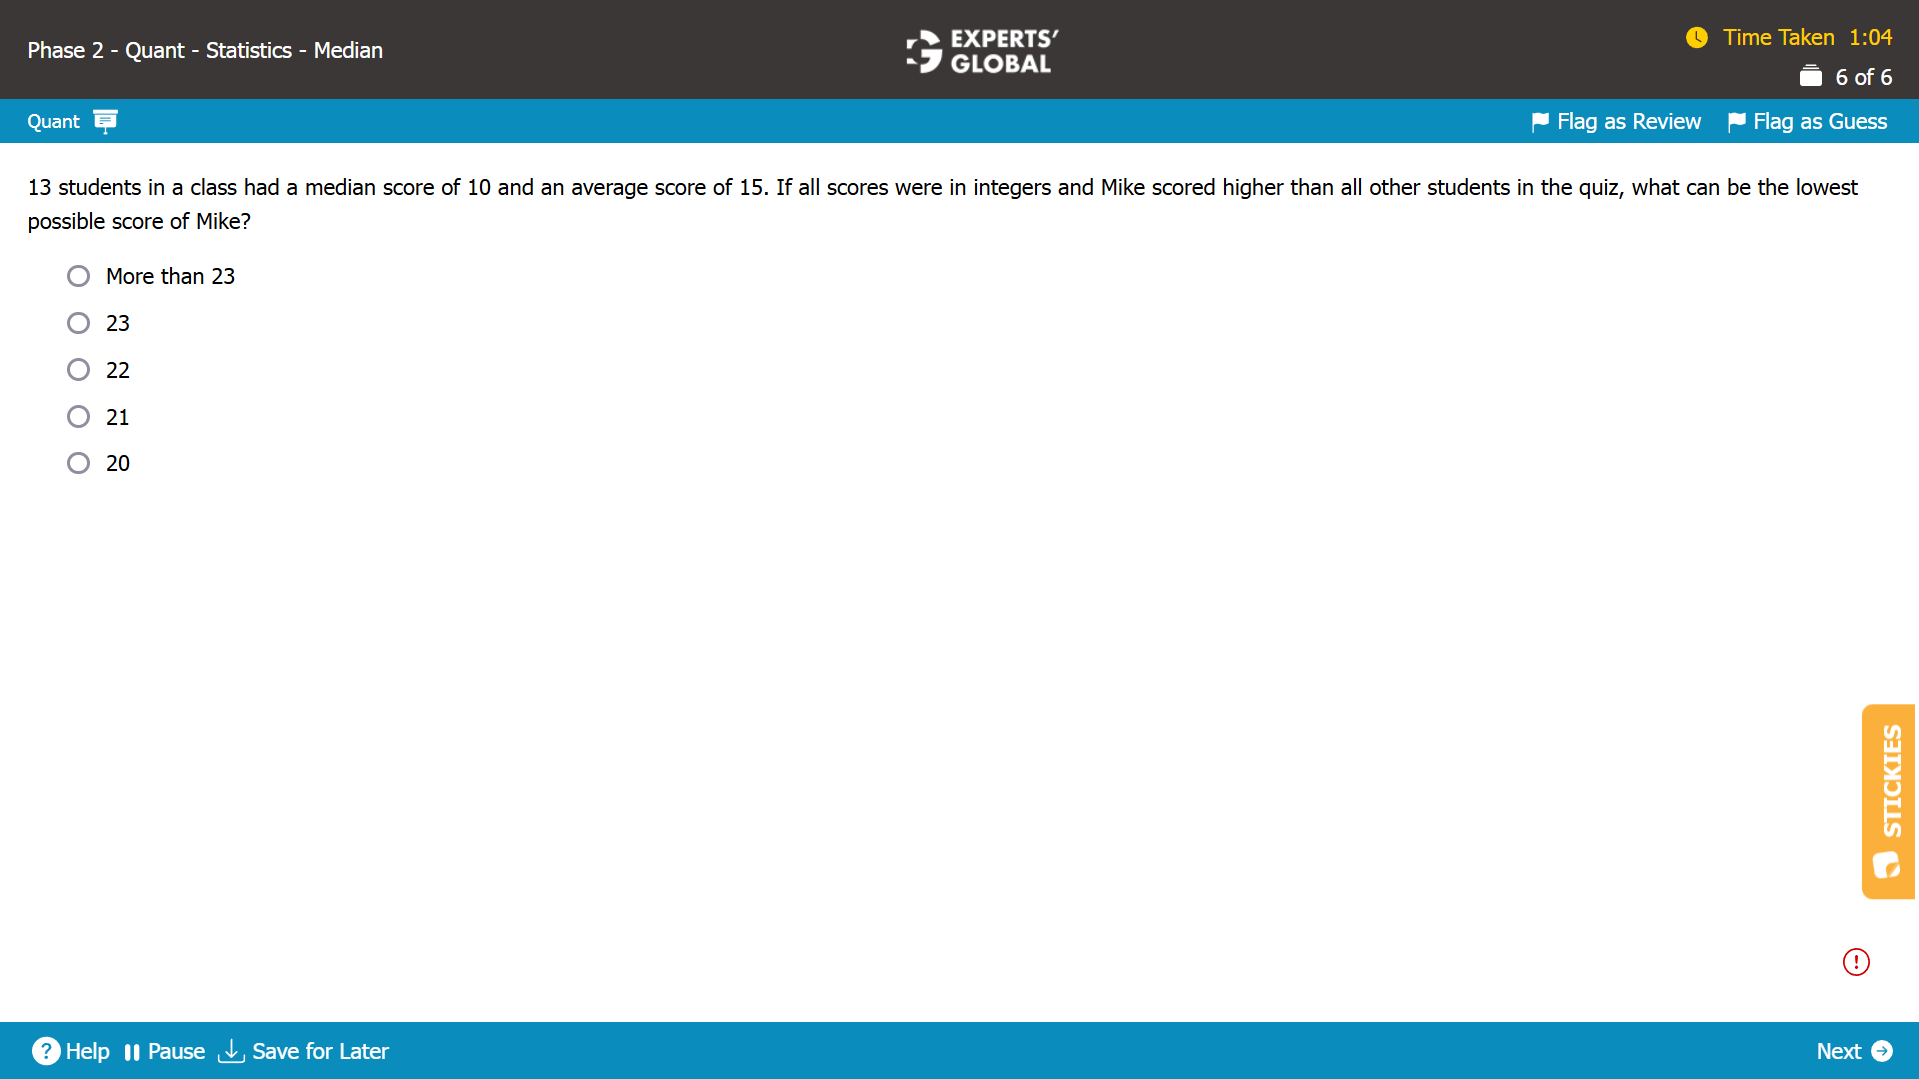
Practice Question 4
Written Explanation
Sum of all values: 13 x 15 = 195
Let’s arrange the 13 values in increasing order: 1 to 13.
The 7th value is 10 and the 13th value needs to be minimized.
Hence, we maximize the values of 1-6 and 8-12.
1-6 can be 10 each, maximum: total- 6 x 10 = 60.
7th value: 10
8-12 can be m – 1 each (where m is the score of Mike): total: 5 x (m – 1)
7th value:10
13th value: m
Sum of all 13 values = 60 + 10 + 5m – 5 + m = 195
Solving, m = 130/6 = 21.67
The lowest numerical value possible of m is 22.
Hence, C is the correct answer choice.
Practice Question 5
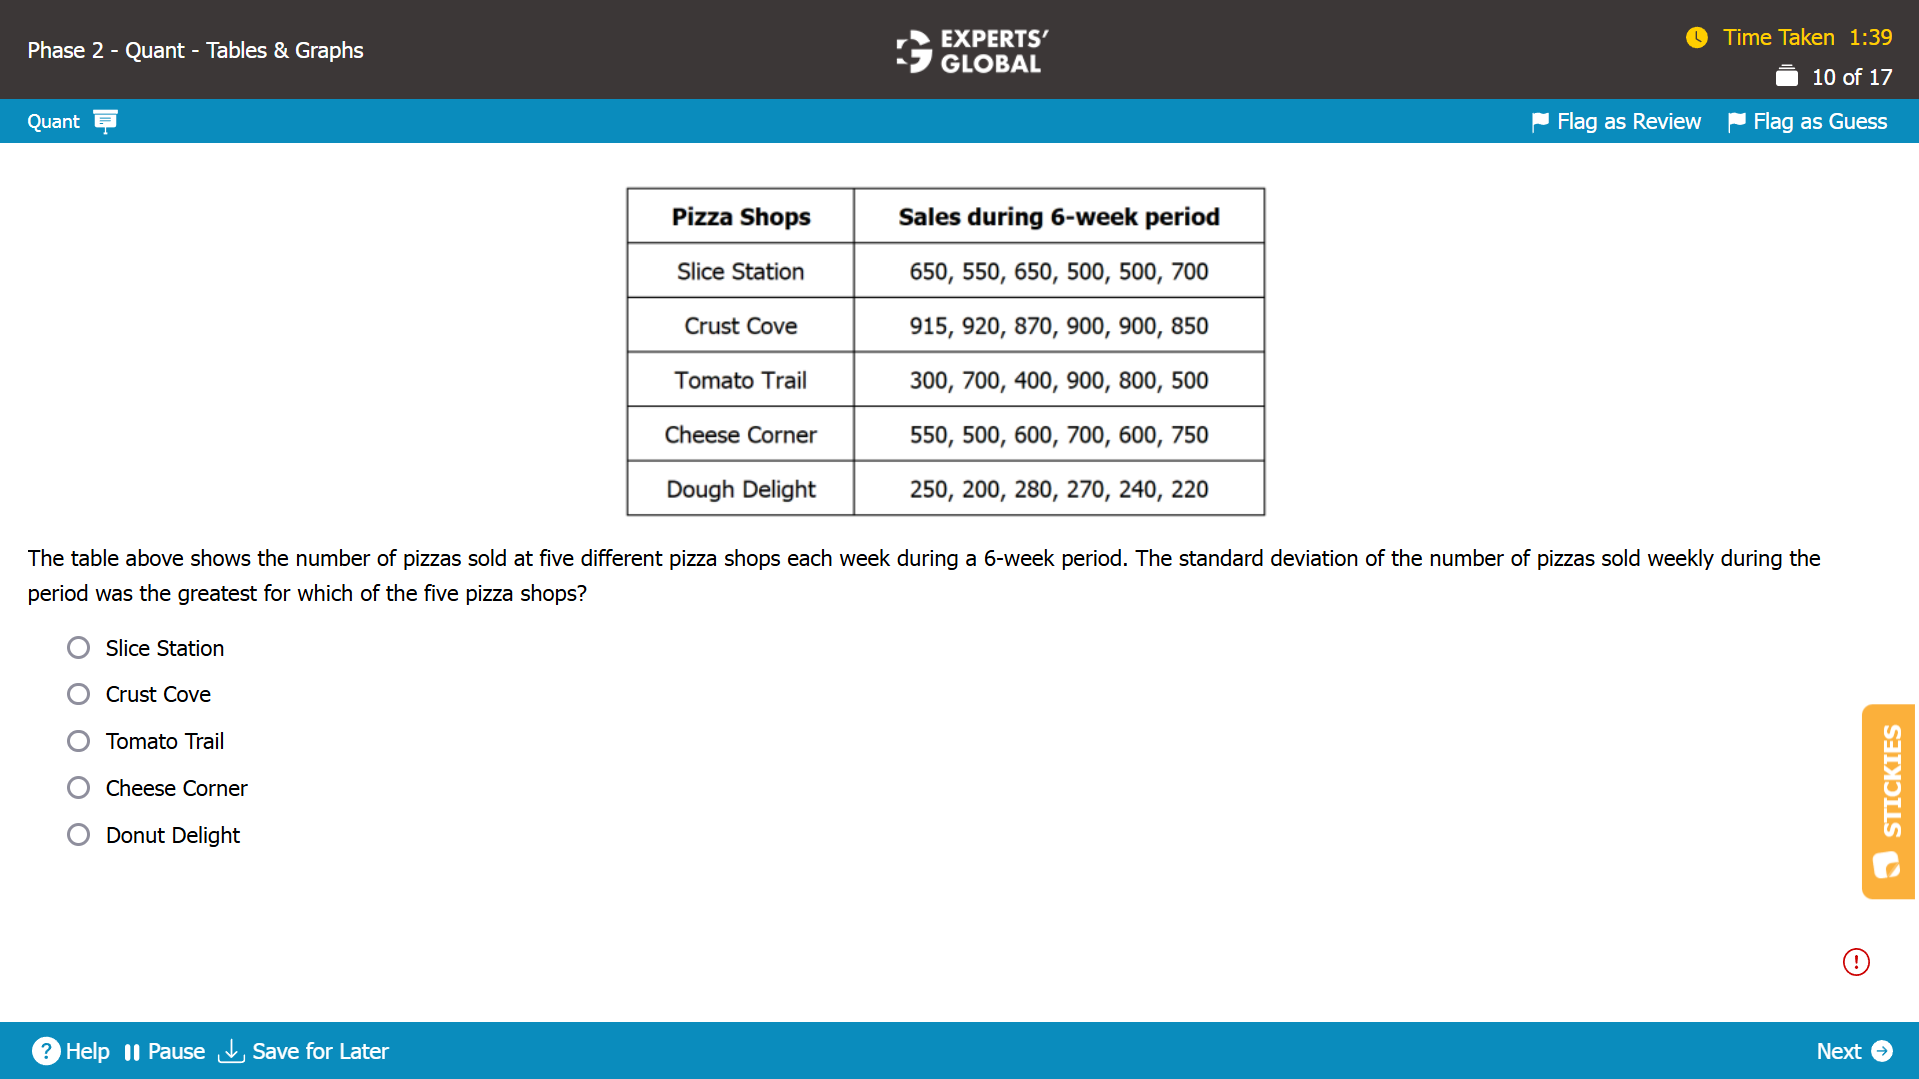
The standard deviation is a measure of how spread out a set of numbers is from the average. A larger spread would imply higher standard deviation.
We need to determine which pizza shop had the greatest standard deviation of the number of pizzas sold.
From the table we see that:
Slice Station: The values are centered around 600. All values including the highest value (700) and the lowest value (500) are relatively close to the mean.
Crust Cove: The values are centered around 900. All values including the highest value (920) and the lowest value (850) are relatively close to the mean.
Tomato Trail: The values are centered around 600. All the values have a deviation of at least 100 from the mean indicating a higher spread of values around the mean.
Cheese Corner: The values are centered around 600. All values including the highest value (700) and the lowest value (500) are relatively close to the mean.
Dough Delight: The values are centered around 240. All values including the highest value (280) and the lowest value (200) are relatively close to the mean.
Since Tomato Trail has the highest spread of values around it’s mean value, the standard deviation of the number of pizzas sold weekly was greatest for Tomato Trail.
C is the correct answer choice.
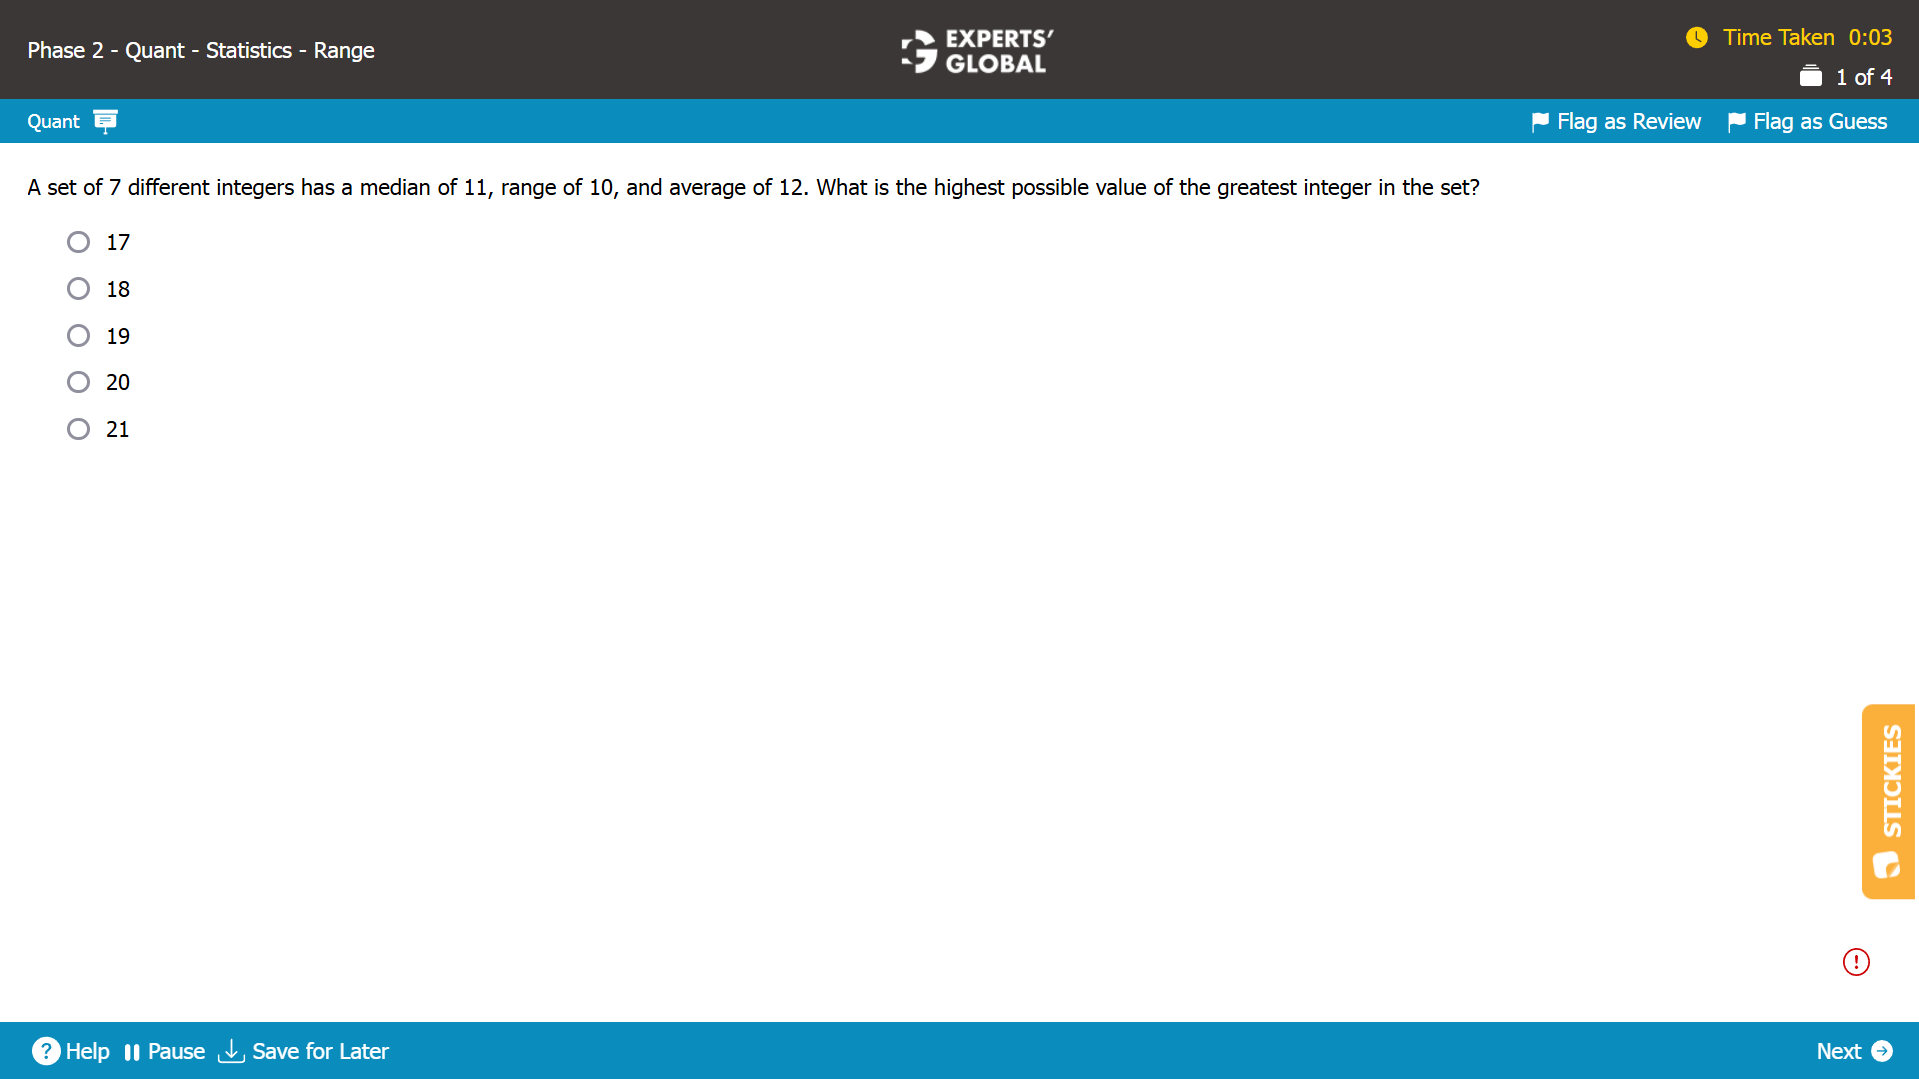
Practice Question 6
Written Explanation
Let’s consider the set of 7 different integers.
The median of the set is 11; so, the 4th element would be 11. The set would look as follows, when put in ascending order.
{Value 1, Value 2, Value 3, 11, Value 4, Value 5, Value 6}
The range of the set is 10; so, when put in ascending order, the lowest and the higher values would differ by 10. The set would look as follows, when put in ascending order.
{x, Value 2, Value 3, 11, Value 4, Value 5, x + 10}
To maximize the value of the greatest integer, other values need to be minimized. So, the set would look as follows, when put in ascending order.
{x, x + 1, x + 2, 11, 12, 13, x + 10}
The average of the set is 12; so, all the values in the set add up to 12 X 7 = 84.
So, x + (x + 1) + (x + 2) + 11 + 12 + 13+ (x + 10) = 84
4x + 49 = 84
4x = 35
x = 8.75
The maximum possible value of the greatest element = x + 10 = 8.75 + 10 = 18.75.
Because the elements are integers, the maximum value will be 18.
B is the correct answer choice.
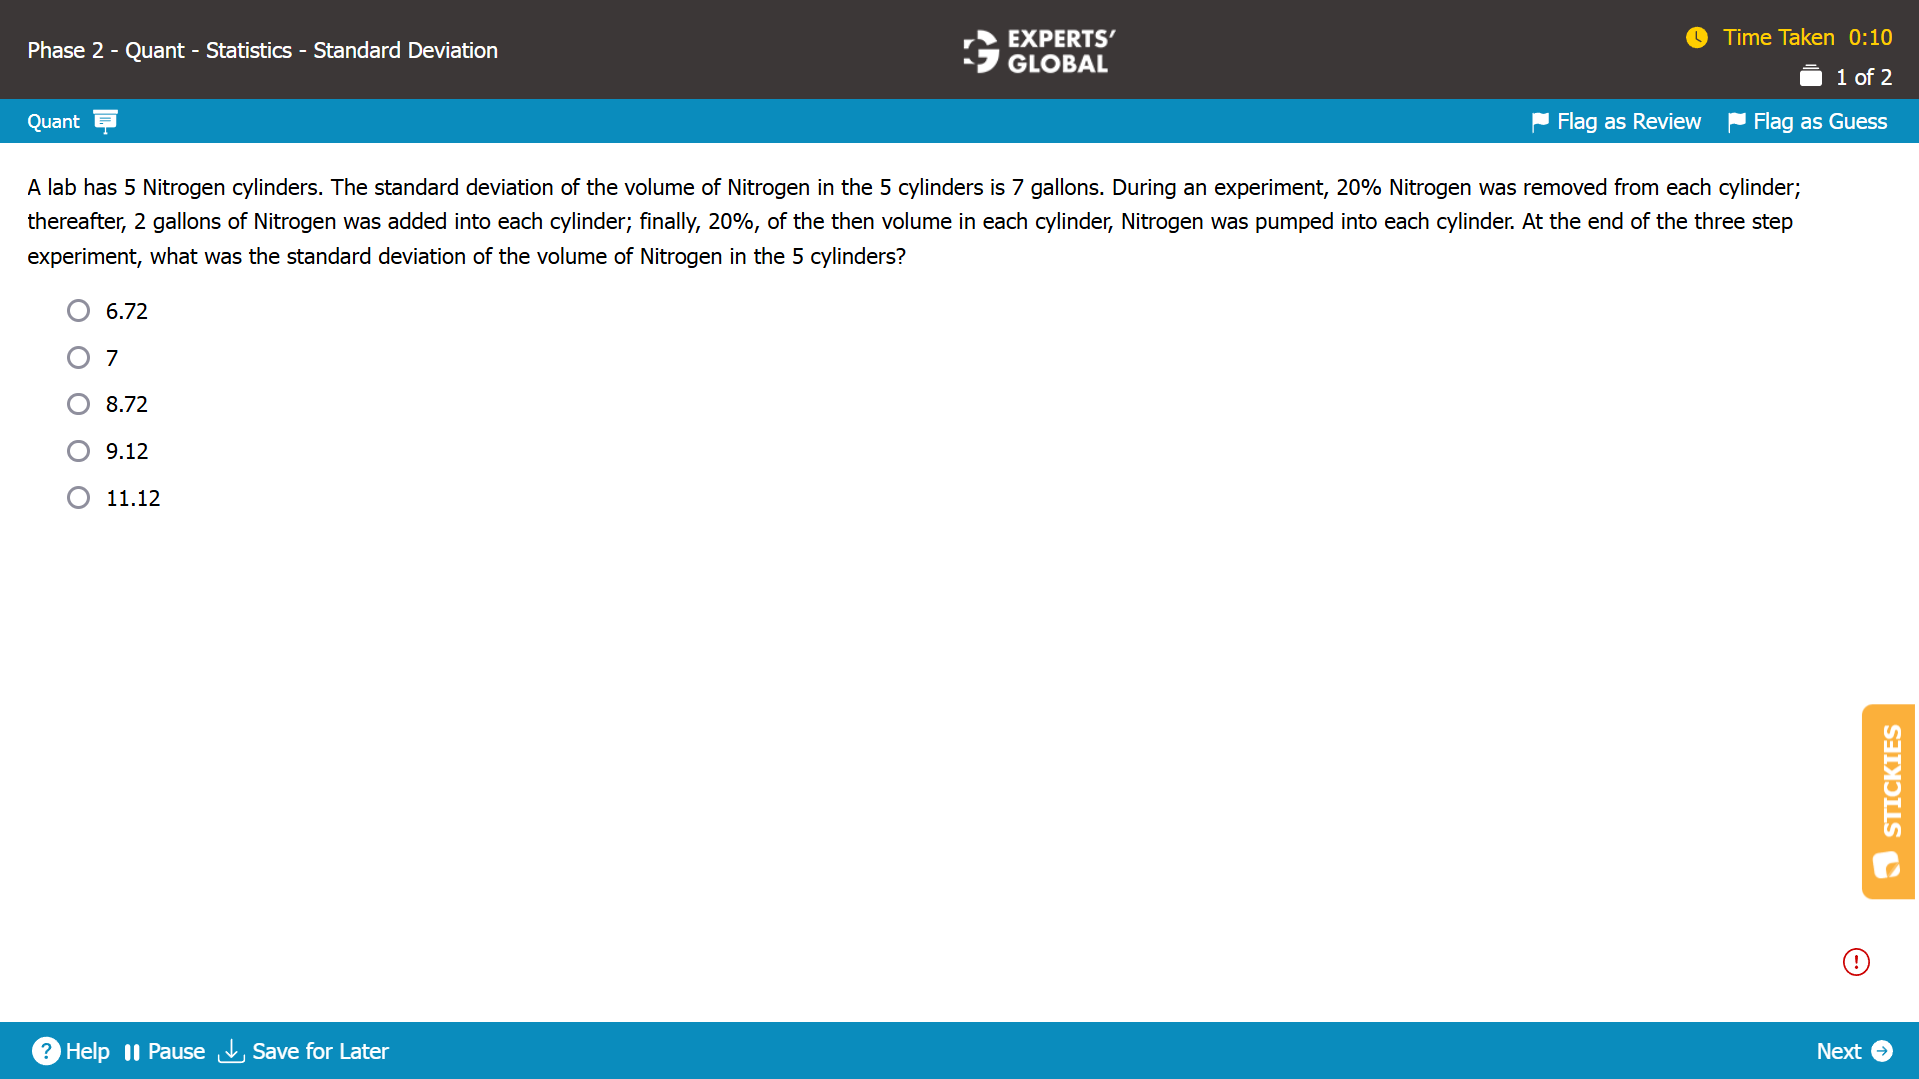
Practice Question 7
Written Explanation
The standard deviation before the experiment = 7 gallons.
In the first step of the experiment, each cylinder was reduced by 20% of its volume.
When each element in a set is increased by the same percentage, the standard deviation of the set changes by the same percentage.
Because the 20% reduction was common to all cylinders, the standard deviation will also reduce by 20%.
The standard deviation after the first step = 7 X 0.8 = 5.6 gallons.
In the second step of the experiment, an equal volume of nitrogen was added to each cylinder. Because the standard deviation does not change when each element in a set is increased by the same absolute value, the standard deviation will remain the same.
The standard deviation after the second step = 5.6 gallons.
In the third step of the experiment, each cylinder was increased by 20% of its volume.
When each element in a set is increased by the same percentage, the standard deviation of the set changes by the same percentage.
Because the 20% increase was common to all cylinders, the standard deviation will also increase by 20%.
The standard deviation after the third step = 5.6 * 1.2 = 6.72 gallons.
A is the correct answer choice.
Practice Question 8
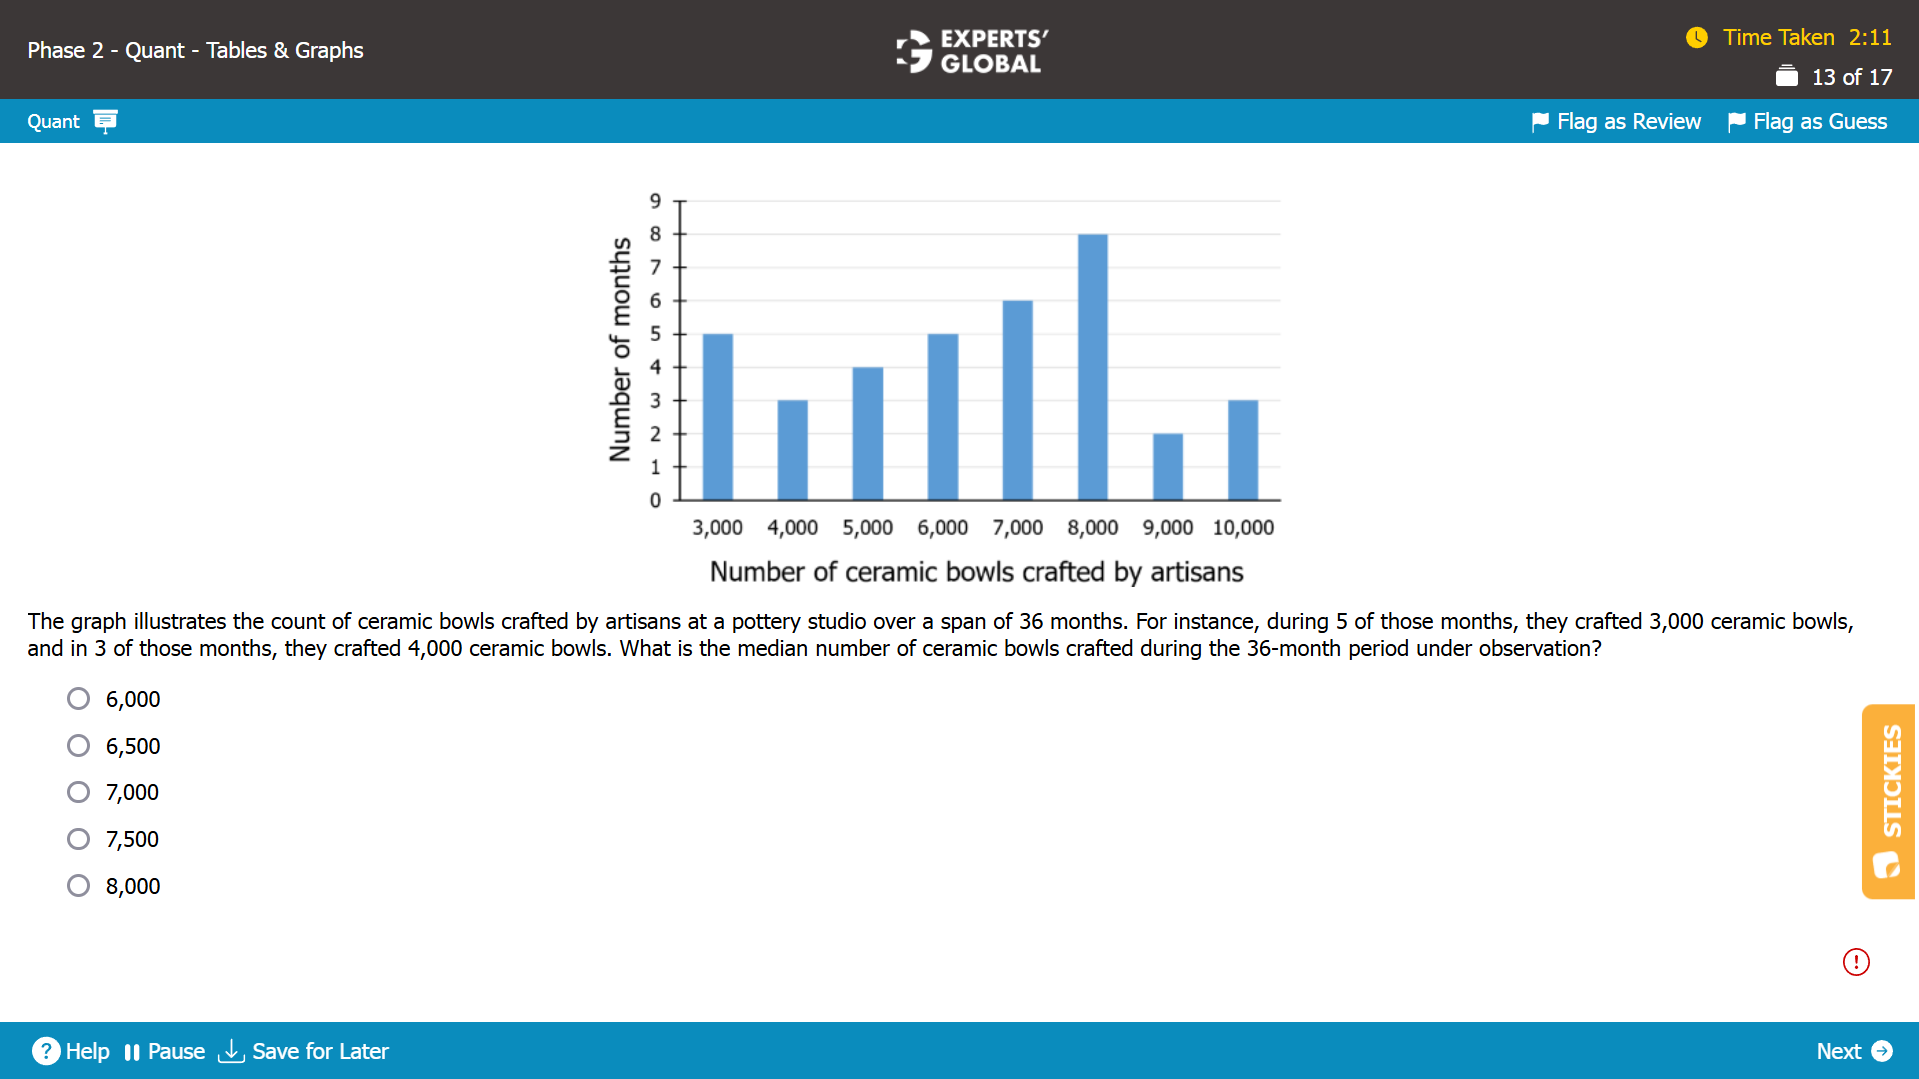
Let C be the set of the number of ceramic bowls crafted by artisans each month over the 36-month period arranged in ascending order.
We need to determine the median of set C.
Since there are 36 values in set C, the median of set C will be the average of the 18th and 19th values.
In 5 of the months, 3,000 ceramic bowls were crafted. This implies that the first 5 elements of the set C are 3,000.
In 3 of the months, 4,000 ceramic bowls were crafted. This implies that the 6th to 8th elements of the set C are 4,000.
In 4 of the months, 5,000 ceramic bowls were crafted. This implies that the 9th to 12th elements of the set C are 5,000.
In 5 of the months, 6,000 ceramic bowls were crafted. This implies that the 13th to 17th elements of the set C are 6,000.
In 6 of the months, 7,000 ceramic bowls were crafted. This implies that the 18th to 23rd elements of the set C are 7,000.
Since the 18th and the 19th value of set C is 7,000 the median is also 7,000.
Hence, the median number of ceramic bowls crafted by artisans each month over the 36-month period is 7,000.
C is the correct answer choice.
Practice Question 9
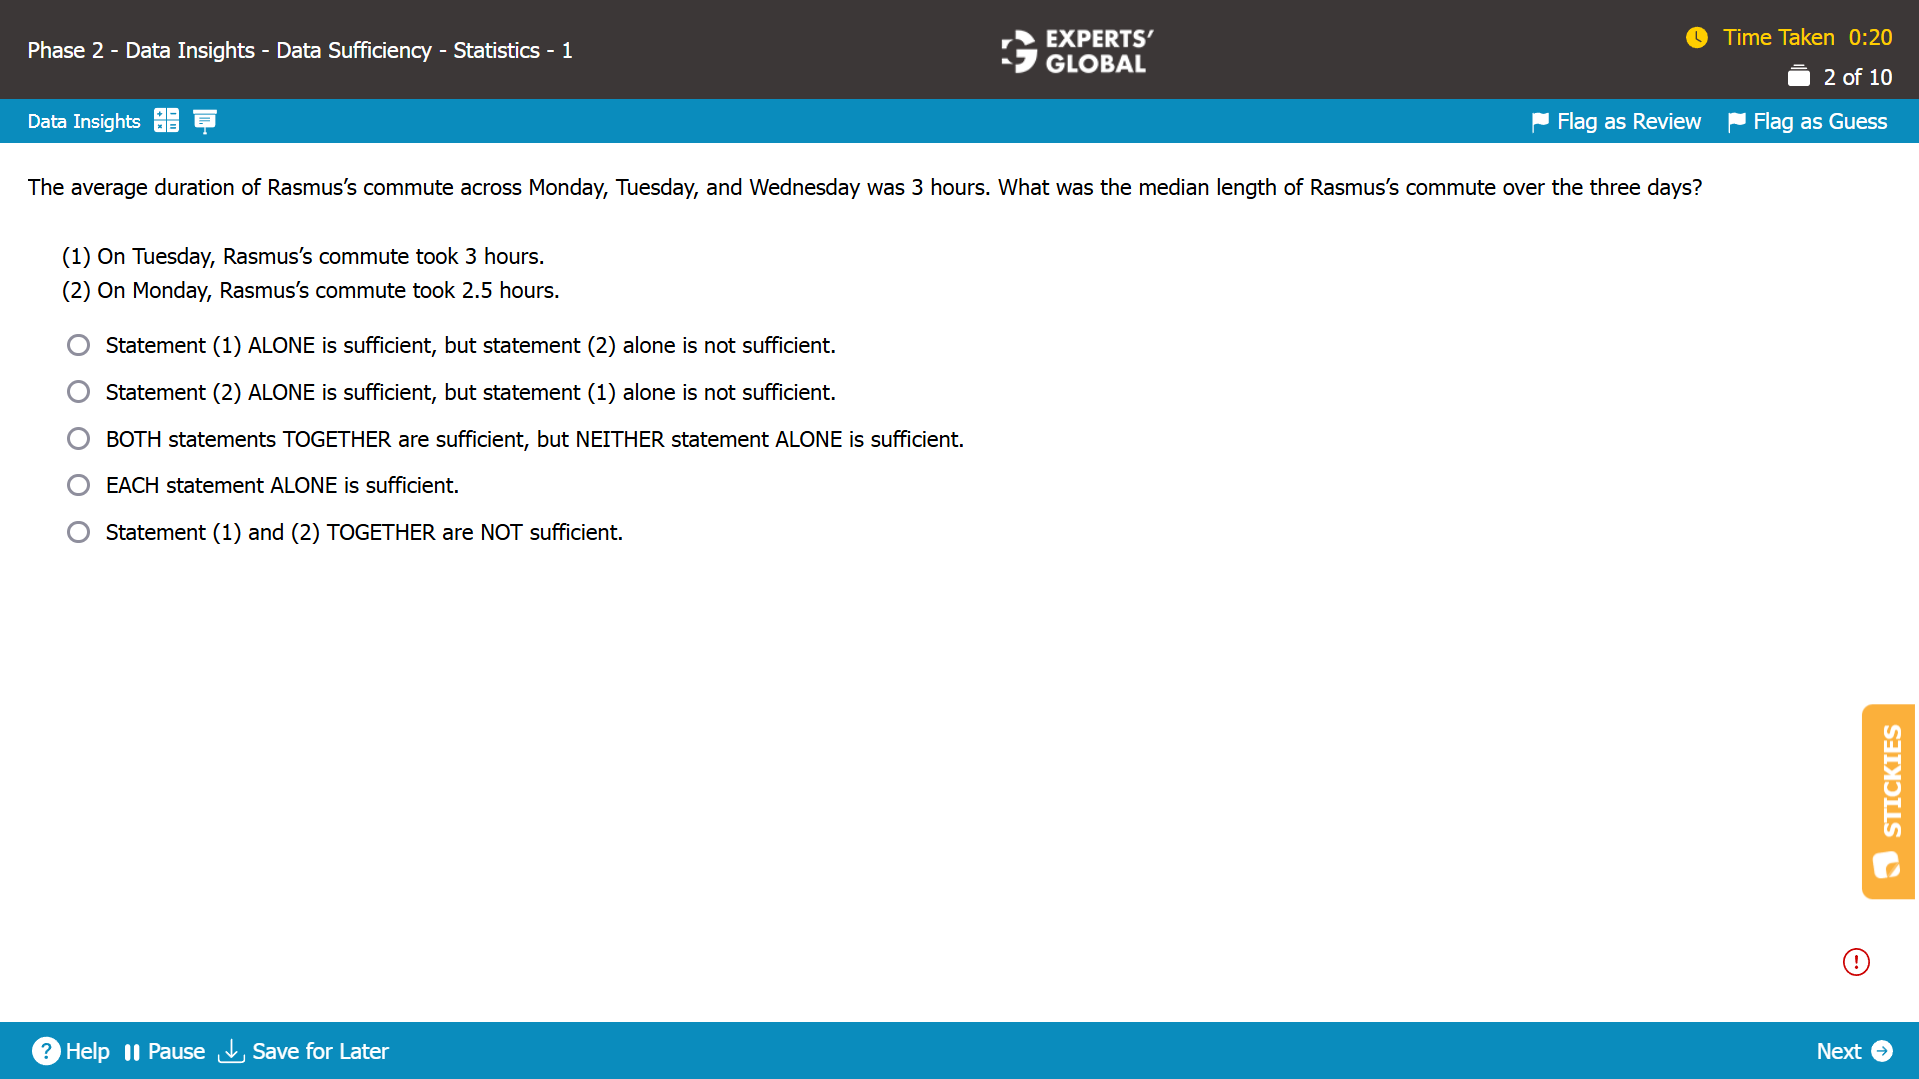
The average duration of commute across the three days was 3 hours.
We need to find whether the median length of commute over the three days can be determined.
Statement (1)
This statement gives us the duration of commute for one of the days as 3 hours.
Since the average duration of the commute is 3 hours, maintaining this average requires that both of the other two values are either equal to 3, or one of them is greater than 3 while the other is less than 3. In either case, the median will be 3.
It is possible to determine the median length of commute over the three days. Hence, Statement (1) is sufficient.
Statement (2)
This statement gives us the duration of commute for one of the days as 2.5 hours.
Possibility 1: If the duration of commute for the three days was {2.5, 1.5, 5}, then it satisfies the given conditions and the median is 2.5.
Possibility 2: If the duration of commute for the three days was {2.5, 3, 3.5}, then it satisfies the given conditions and the median is 3.
It is NOT possible to determine the median length of commute over the three days. Hence, Statement (2) is insufficient.
A is the correct answer choice.
Practice Question 10
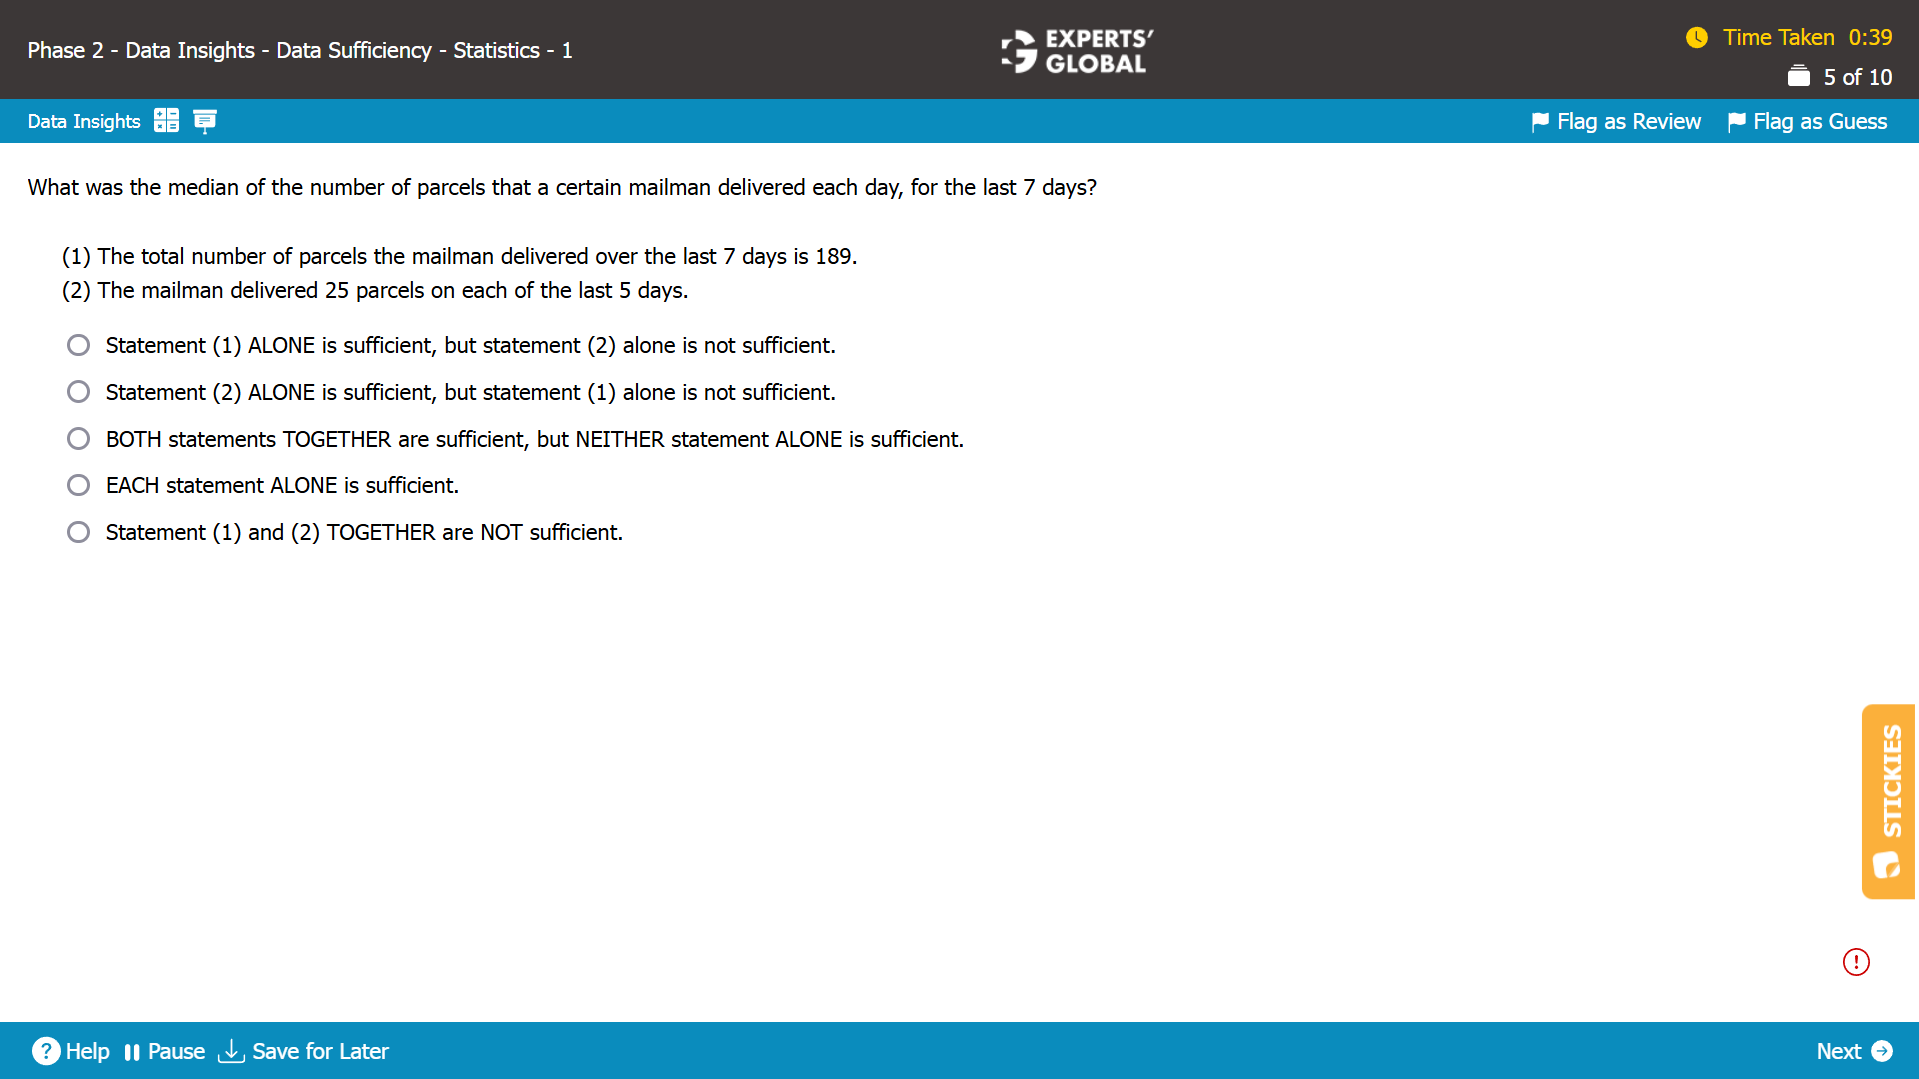
Let A be the set of the number of parcels delivered each day, for the last 7 days.
We need to find whether the median of set A can be determined.
Statement (1)
Possibility 1: If A = {25, 25, 25, 25, 25, 25, 39}, then it satisfies the given conditions and the median of set A is 25.
Possibility 2: If A = {26, 26, 26, 26, 26, 26, 33}, then it satisfies the given conditions and the median of set A is 26.
It is NOT possible to determine with certainty the number of parcels delivered each day, for the last 7 days. Hence, Statement (1) is insufficient.
Statement (2)
This statement specifies that set A has 5 elements as 25, which implies that the set A is of the form {x, y, 25, 25, 25, 25, 25}.
Since the median of this set is the 4th value when arranged in ascending order, regardless of the values chosen for the first 2 elements of the set, the median will always be 25. Hence, Statement (2) is sufficient.
B is the correct answer choice.
How and Where to Practice GMAT-style Statistics Questions
Real practice for Statistics problems begins when you solve them on a software simulation that closely matches the official GMAT interface. You need a platform that presents the question stem and the statistical information in a GMAT like layout, lets you work with the data and answer choices naturally, and provides all the on screen tools and functionalities that you will see on the actual exam. Without this kind of experience, it is difficult to feel fully prepared for test day. High quality Statistics questions are not available in large numbers. Among the limited, genuinely strong sources are the official practice materials released by GMAC and the Experts’ Global GMAT course.
Within the Experts’ Global GMAT online preparation course, every Statistics problem appears on an exact GMAT like user interface that includes all the real exam tools and features. You work through more than 300 Statistics questions in quizzes and also take 15 full-length GMAT mock tests that include several Statistics questions in roughly the same spread and proportion in which they appear on the actual GMAT.
All the best!