
Invest 30 seconds...
...for what may lead to a life altering association!
Help Line
- +91.8800.2828.00 (IND)
- 1030-1830 Hrs IST, Mon-Sat
- support@expertsglobal.com
33% off ends soon:GMAT/GRE prep + applications bundle. Profile building, longer mentoring, better results. Inquire
Begin by understanding the overall message of the graph without diving into details. Then read the question statement carefully. Next, locate only the specific data required for each statement. Finally, cross-check your reasoning before confirming your answer.

Graphics Interpretation questions in the Data Insights section test whether you can read a visual correctly, locate only the essential data, and complete one or two statements with accuracy. The graph may feel busy, yet your task is focused. You need a steady process that filters noise and turns the picture into clear, answerable information.
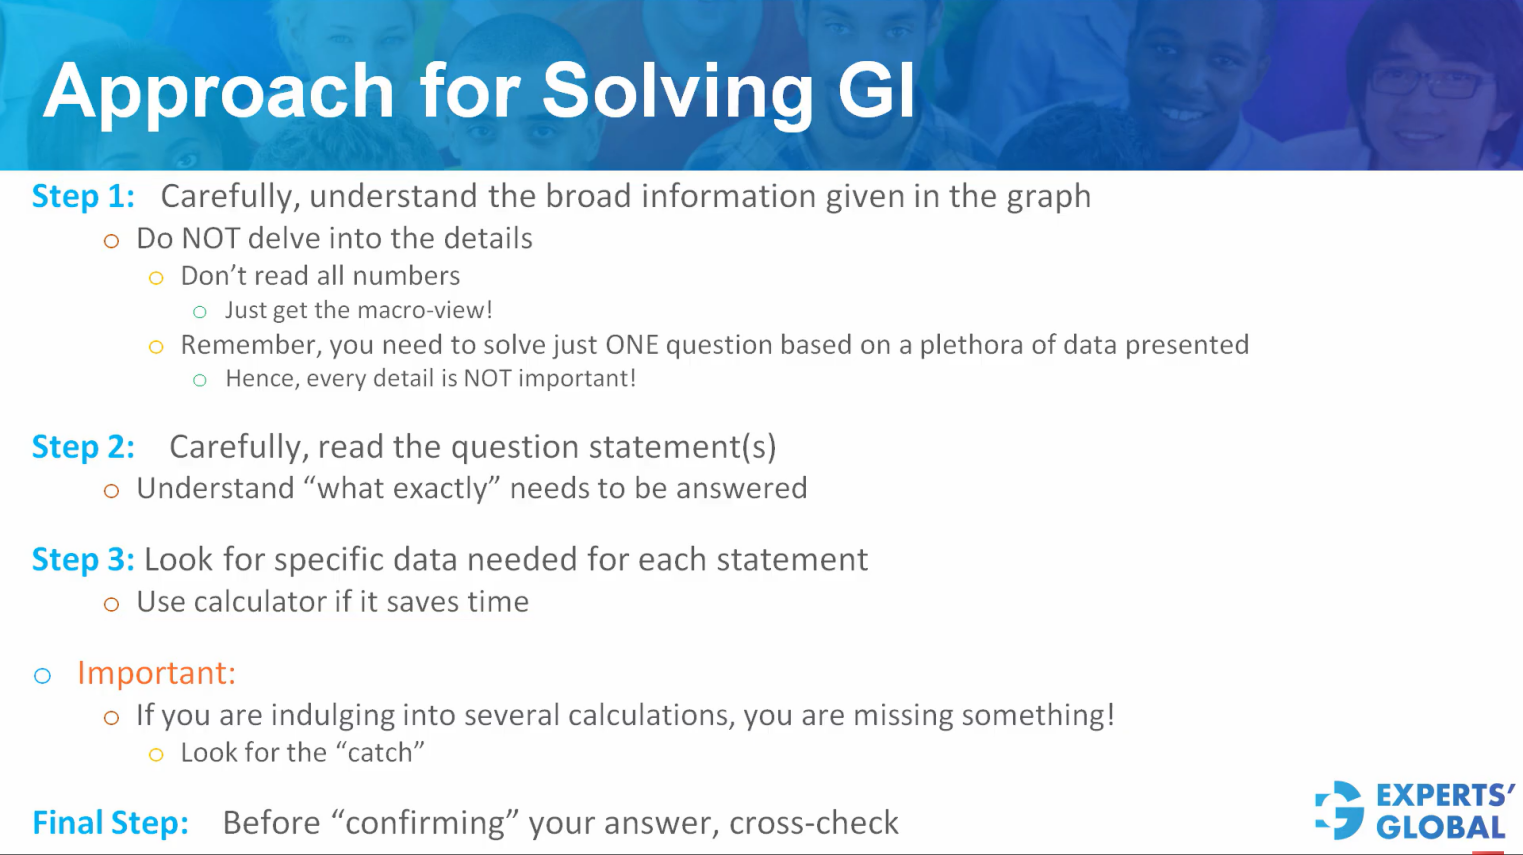
Begin by understanding the broad message of the graph. Read the title. Read the legend. Note the axes, units, and scale. Identify categories and the relationships being displayed. Do not read every label or number. You are solving one question, not auditing the dataset. At this stage your goal is orientation, not calculation.
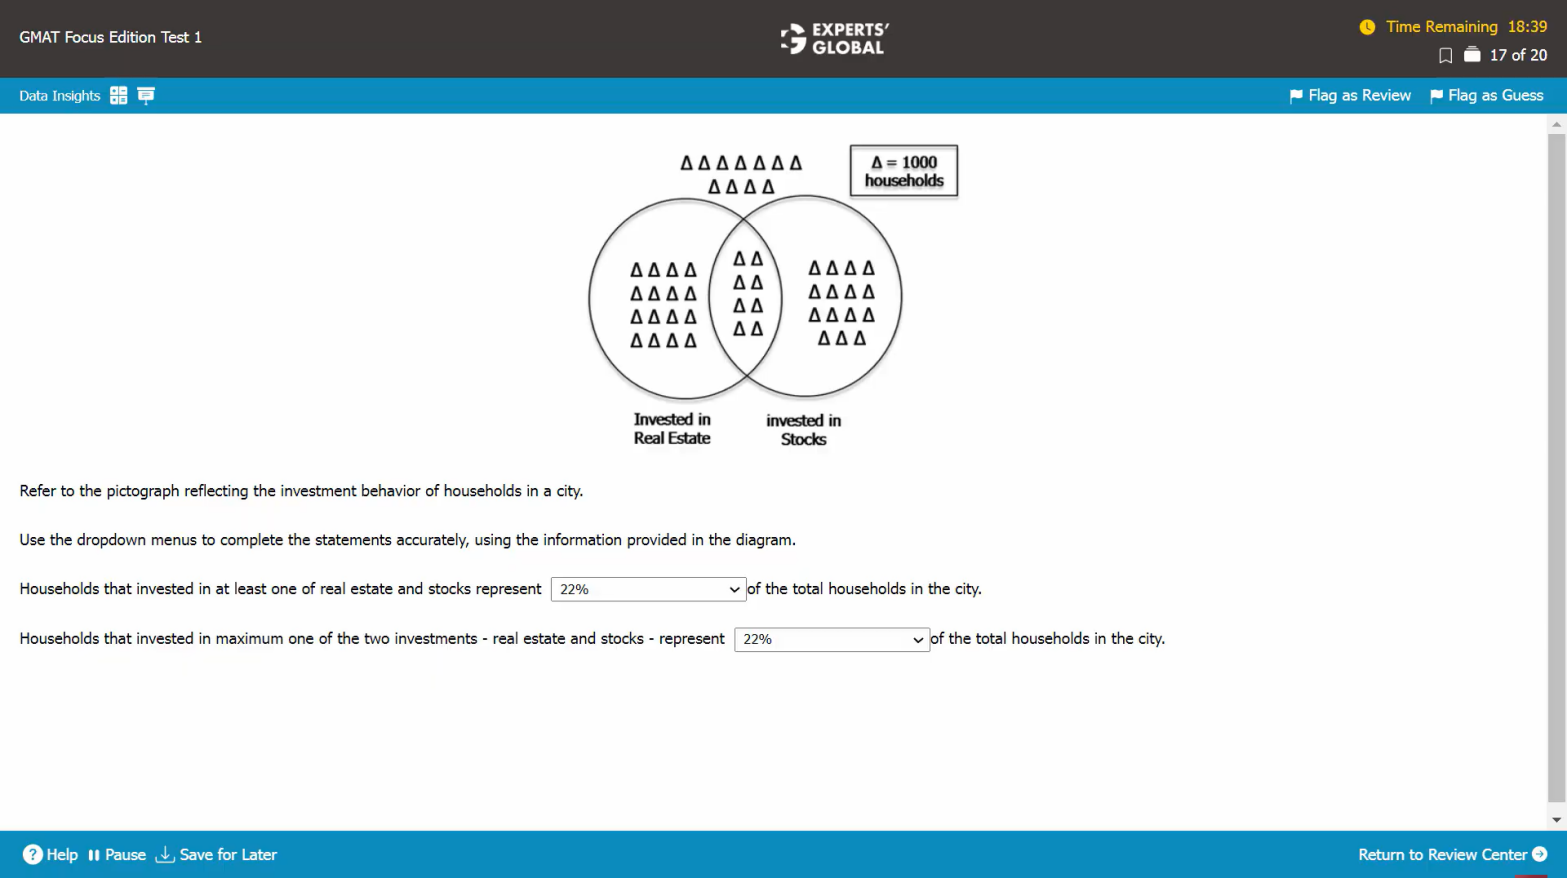
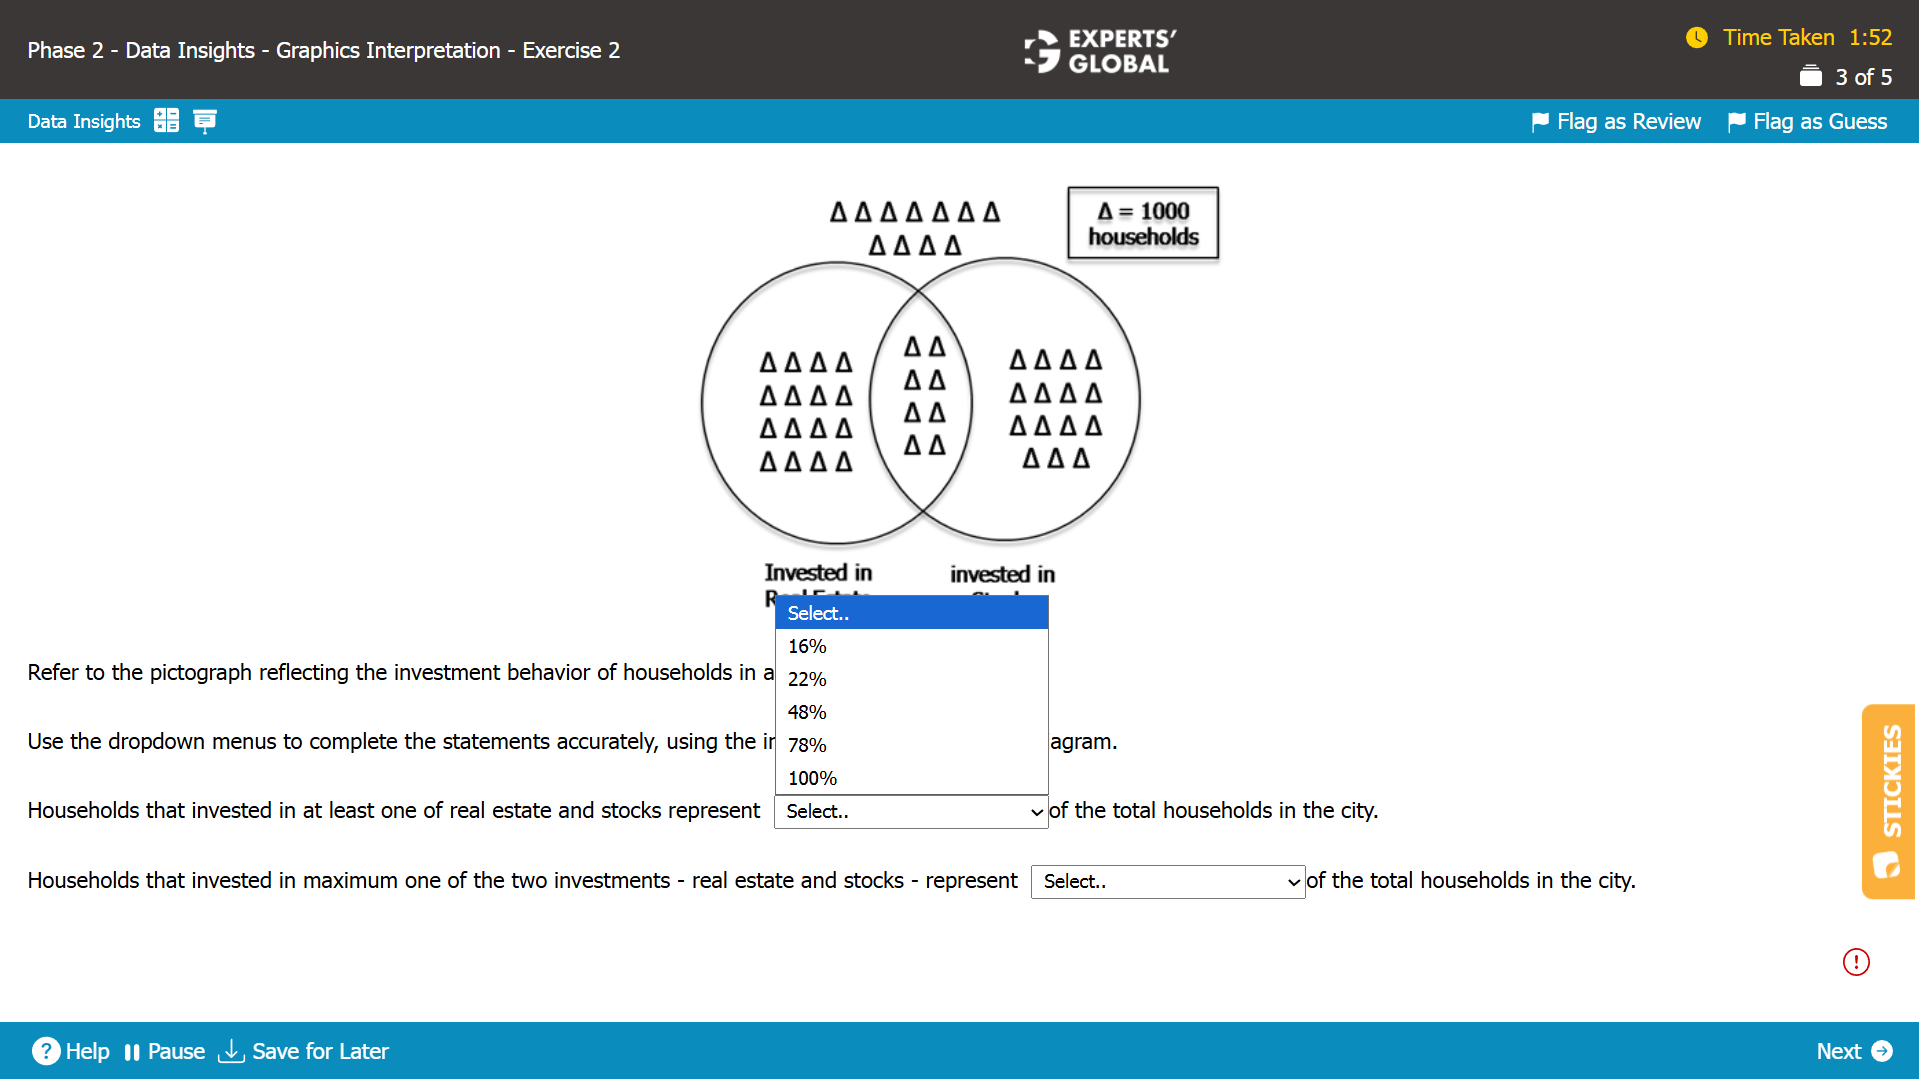
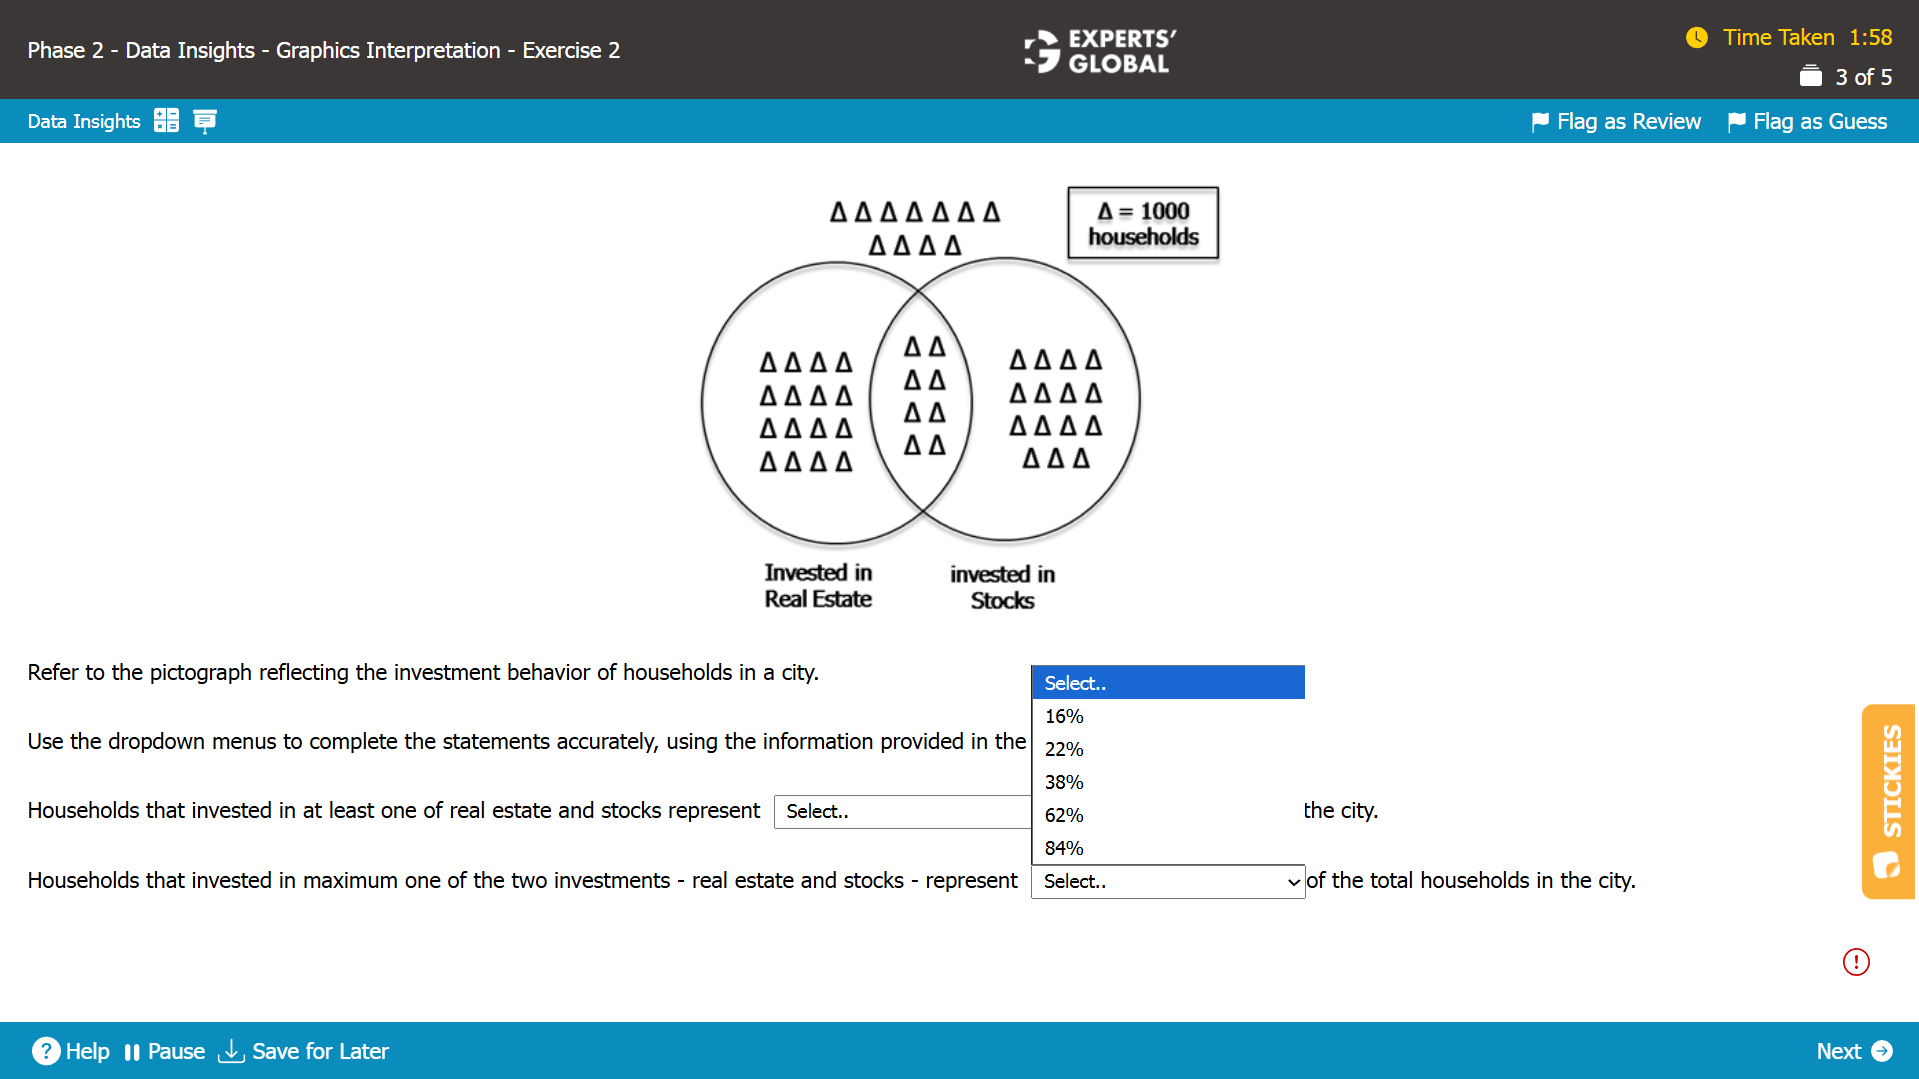
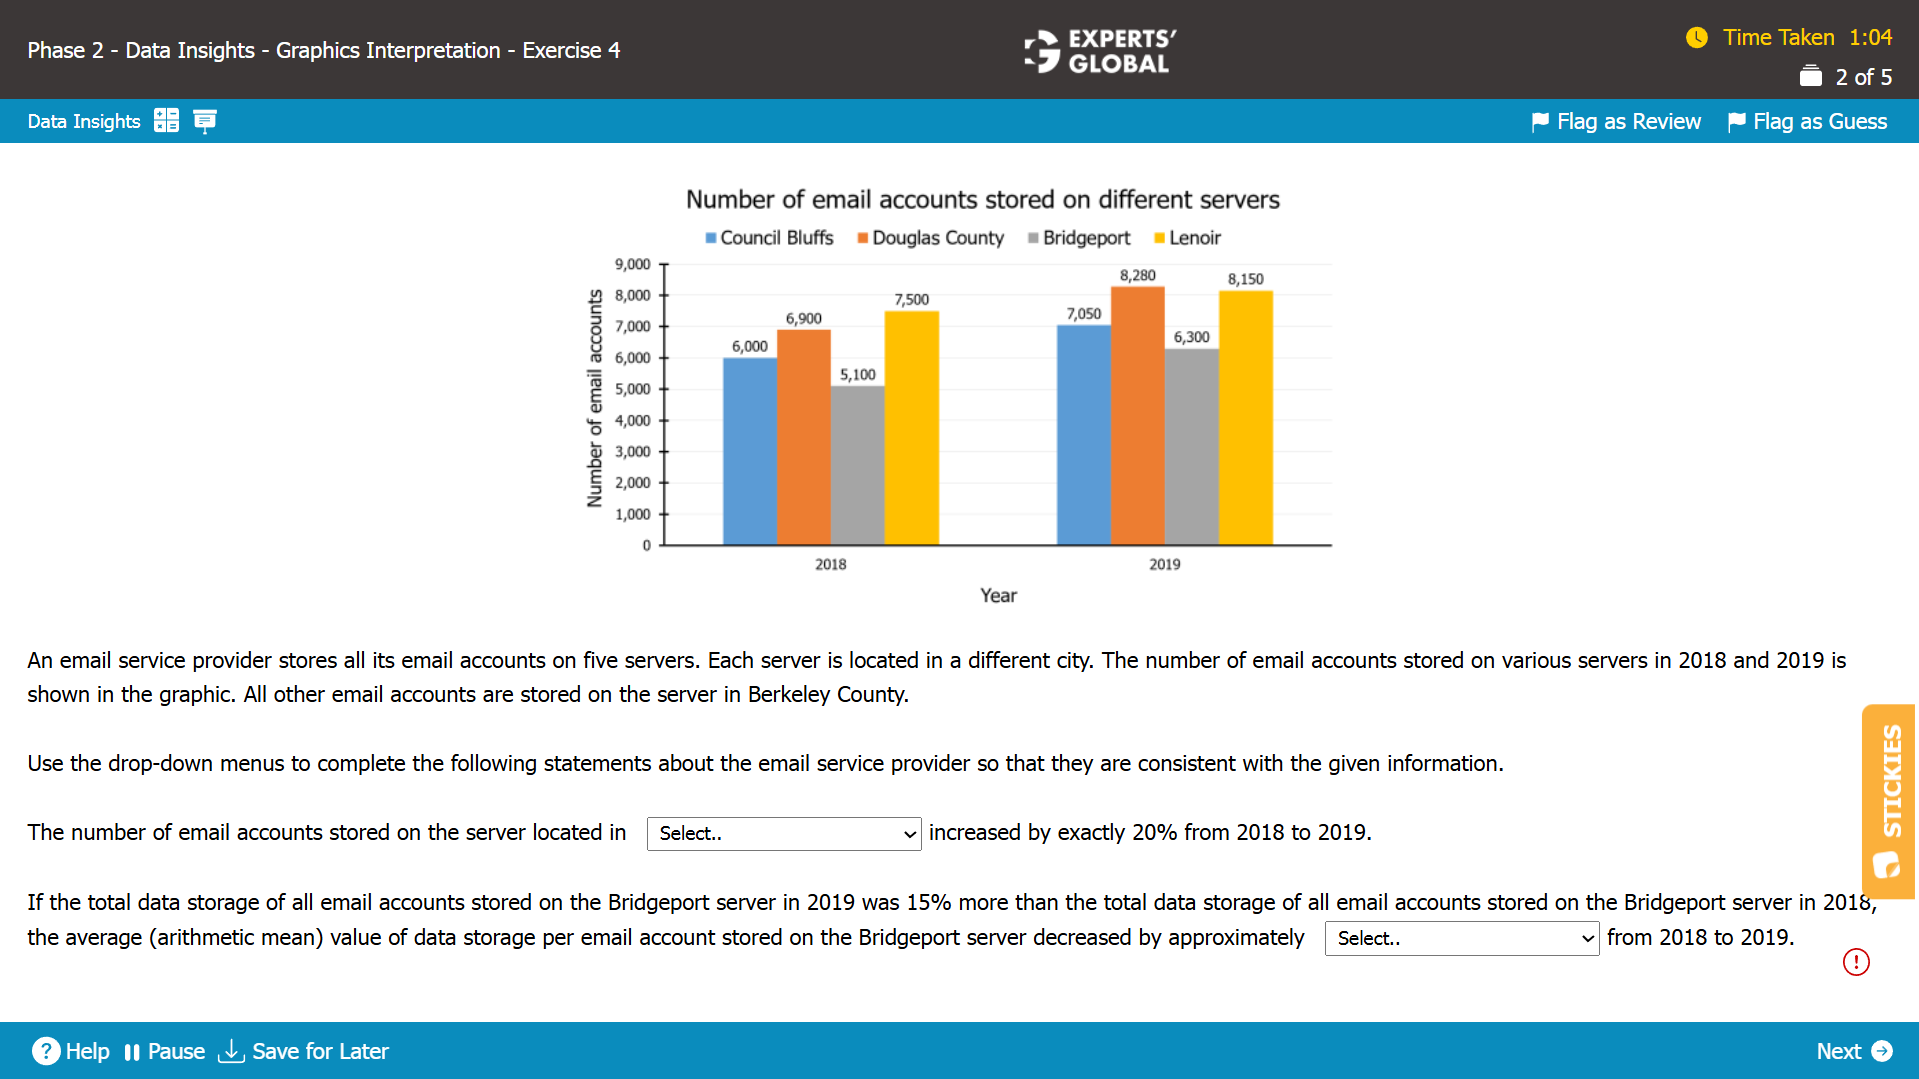
Correct Answer: 22%, 22%
Next, read the statements you must complete from the drop-down lists. Clarify exactly what must be produced for each statement. Common asks include a percent of a whole, a difference between categories, a ratio, or a comparison such as greater than, equal to, or less than.
Now return to the graph and touch only what the statements require. If a statement is a percent of a whole, identify the relevant part and the base. If it is a difference, mark the two exact segments you must compare. If the display is stacked, check whether the stack totals are visible or must be inferred. When the graph offers a built-in way to simplify reading, use it. On some displays, a quick visual ordering or a clear legend can replace arithmetic. If a calculator is available, open it only when it truly saves time. In many cases, proportional reasoning or careful counting is faster and safer.
A key idea in Graphics Interpretation is that too much calculation usually signals the wrong path. The GMAT gives you a calculator for Data Insights, but using it repeatedly can slow you down. If you start doing long or repeated calculations, pause and rethink your approach. There is almost always a simpler way to interpret the graphic. For example, if a question asks which category shows the greatest variation, you do not need exact computations. A quick visual check of which bar or line shows the widest spread will guide you faster. Graphics Interpretation rewards clear observation and logical judgment far more than mechanical number-crunching. Efficiency matters as much as accuracy, and the simplest interpretation is often the right one.
Before you submit your answer in Graphics Interpretation, pause for a brief final check. Small oversights can easily cause errors. Read the question stem again, confirm that you understood what was asked, and ensure your chosen values truly match the graph. This quick review is especially helpful when options are close or when your answer depends on a small difference in the data.
Graphics Interpretation is not about racing through every number in the graph. It is about smart filtering. This question type tests how well you spot key patterns, ignore distractions, and use clear logic within limited time. When you stay calm, focus on the overall message of the graphic, and then zoom in on only the data you need, you build a skill that goes beyond the GMAT. The same composed, structured thinking is exactly what real-world analytical decisions demand.
Real practice for graphics interpretation begins when you work on a software simulation that closely matches the official GMAT interface. You need a platform that shows the charts and graphs in a GMAT-like layout, lets you interact with the data naturally, and provides all the on screen tools and functionalities you will see on the actual exam. Without this experience, it is difficult to be fully ready for test day.
High quality data insights questions in general, and graphics interpretation questions in particular, are not available in abundance. Among the limited, genuinely strong resources are the official practice materials released by GMAC and the Experts’ Global GMAT course.
Within the Experts’ Global GMAT online preparation course, every graphics interpretation question appears on an exact GMAT-like user interface that includes all the real exam tools and features. You work through more than 100 graphics interpretation questions in quizzes and also take 15 full length GMAT practice tests that include several graphics interpretation questions in the same spread and proportion in which they appear on the actual GMAT.
